

AI Job Displacement Statistics 2026: Jobs Lost, Replaced & Forecasts
Artificial intelligence is already reshaping parts of the labor market, but the evidence does not support a single national count of jobs that have been “replaced by AI.”
The strongest studies available in 2026 point to a more complicated picture. Some employers explicitly cite AI when announcing job cuts, younger workers in highly exposed occupations appear to face weaker hiring, and major institutions estimate that a large share of jobs could be exposed to AI without necessarily disappearing.
This article brings together the best available evidence on AI job displacement, including observed job losses, employer-attributed cuts, hiring effects, occupational exposure, automation potential, and 2030 forecasts. Each statistic is kept in its original context so that exposure, task automation, announced cuts, and actual displacement are not treated as the same thing.
For broader data on employee use, business adoption, productivity, time savings, and workplace AI adoption, see our AI in the Workplace Statistics research.
AI Job Displacement Statistics and Numbers: (Editor Picks)
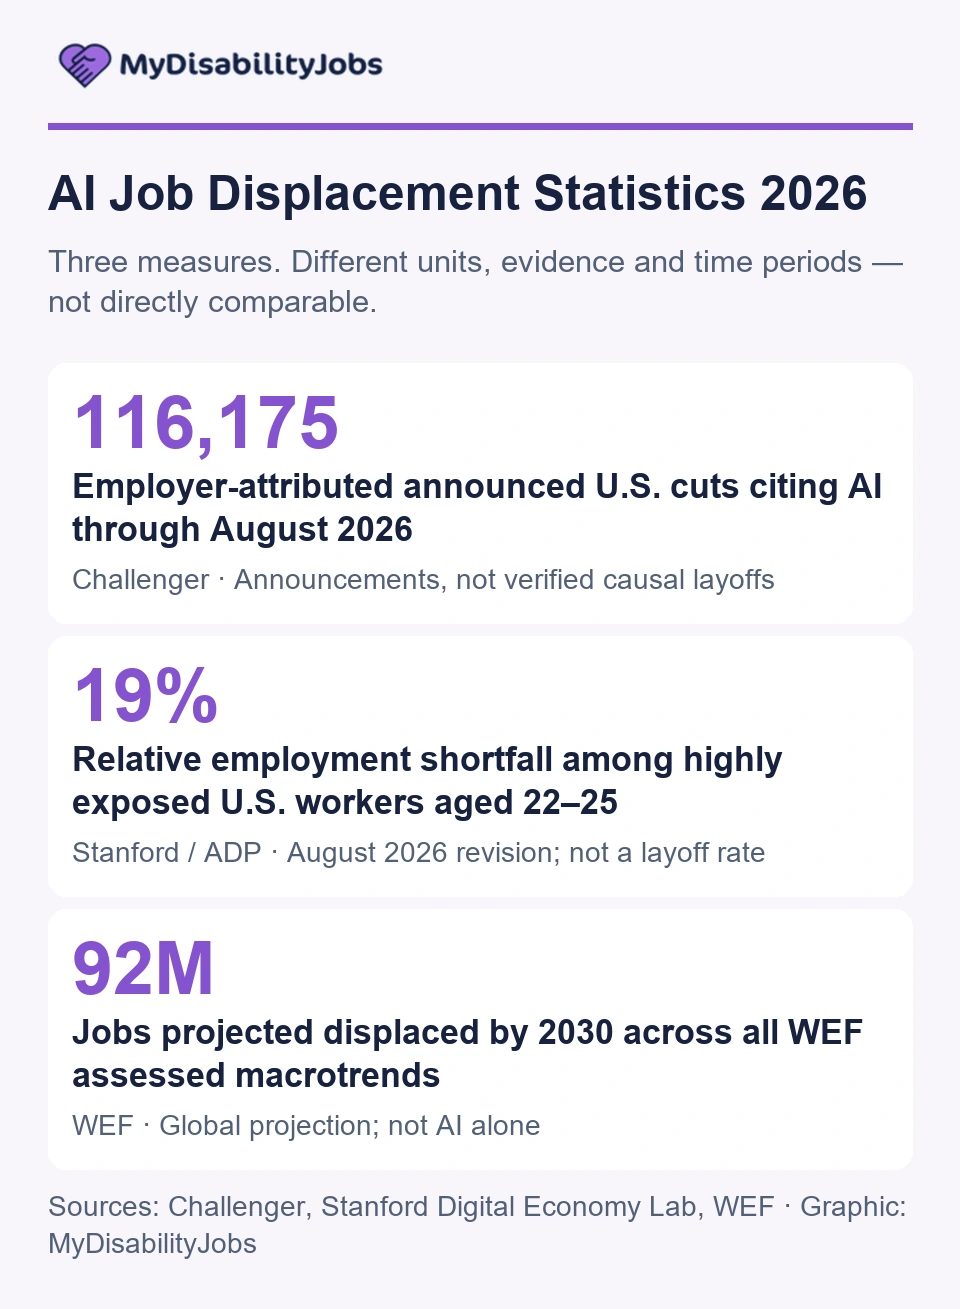
- AI-attributed job cuts: 116,175 announced U.S. job cuts were attributed to AI by employers through August 2026.
- Total announced cuts: U.S. employers announced 529,914 job cuts across all reasons from January through August 2026.
- Young workers: Employment among highly AI-exposed U.S. workers aged 22–25 showed a 19% relative shortfall versus less-exposed peers.
- Hiring vs layoffs: 15% of AI-using service firms reported fewer hires, compared with 4% reporting AI-related layoffs and 13% reporting more hires.
- Job postings: A 10-percentage-point higher automatable-task share was associated with 5% fewer job postings by the end of 2023 and 8% fewer by Q1 2025.
- Young-worker job finding: Job finding among exposed workers aged 22–25 showed tentative weakness of about 14% relative to the comparison benchmark.
- Global GenAI exposure: Around one-quarter of global employment has some exposure to generative AI.
- Highest GenAI exposure: 3.3% of global employment falls into the highest GenAI exposure category.
- Global AI exposure: Around 40% of global employment is exposed to AI, rising to roughly 60% in advanced economies.
- Job-posting exposure: 26% of U.S. job postings were classified as highly exposed to GenAI transformation, 54% as moderately exposed, and 20% as minimally exposed.
- Fully transformable skills: Only 19 of 2,884 skills analyzed — 0.7% — were rated fully transformable.
- 2030 displacement: 92 million jobs are projected to be displaced and 170 million created by 2030 across all assessed macrotrends, for a net gain of 78 million.
- Work hours: Activities accounting for about 30% of U.S. work hours could potentially be automated by 2030.
- Occupational transitions: Roughly 12 million additional occupational transitions are modeled through 2030 across the economic drivers included in the scenario.
Table of Contents
- How Many Jobs Has AI Actually Replaced?
- AI-Attributed Job Cuts in 2026
- AI May Be Affecting Hiring Before Layoffs
- AI and Younger Workers: What the Evidence Shows So Far
- What Observed Labor-Market Evidence Shows So Far
- AI Exposure Is Not the Same as Job Replacement
- Which Jobs Are Most Exposed to AI?
- Exposure, Automation Potential, and Job Loss Measure Different Things
- How Many Jobs Could AI Replace by 2030?
- Major AI and Automation Employment Estimates Compared
- Commonly Misquoted AI Job Statistics
- Why Forecasts Differ So Much
- What Can We Conclude About AI Job Displacement in 2026?
- Data Limitations
- Methodology and Source Selection
- Frequently Asked Questions
How Many Jobs Has AI Actually Replaced?
There is no authoritative national figure showing exactly how many jobs have been causally eliminated by AI. Existing research measures different outcomes, including employer-attributed announced cuts, employment changes, hiring patterns, and task exposure.
- Employer-attributed layoff announcements provide one of the clearest measures of jobs explicitly linked to AI, but they do not confirm that every announced cut occurred or that AI was the sole cause.
- U.S. labor-market research has not yet identified a clear aggregate employment or wage effect that can be attributed to AI across the economy.
- Administrative data from Denmark show substantial changes in tasks and work organization without large measured effects on earnings or recorded hours over the period studied.
- Employer surveys suggest that AI can affect employment through reduced hiring as well as layoffs, meaning job-loss counts alone may miss part of the labor-market impact.
- Modeled AI exposure should not be treated as evidence that jobs have already been replaced; exposure identifies tasks that may be affected by AI, not realized employment losses.
Sources: Challenger, Gray & Christmas; Yale Budget Lab; Humlum & Vestergaard; Federal Reserve Bank of New York.
AI-Attributed Job Cuts in 2026
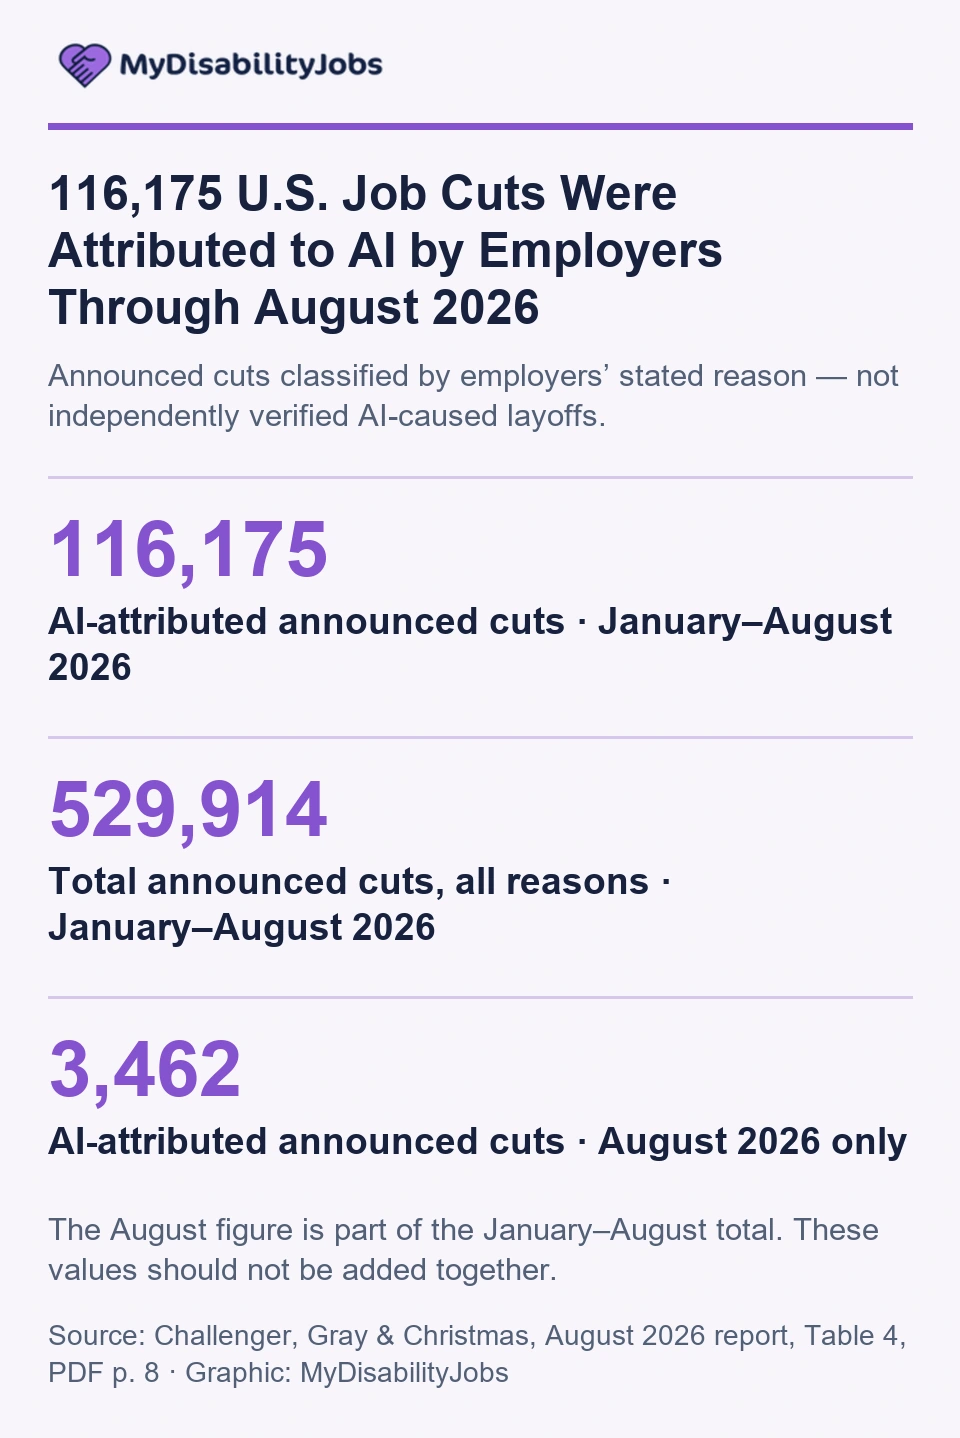
AI is one of the reasons U.S. employers have cited when announcing job cuts in 2026. These figures measure announced reductions based on employers’ stated reasons, rather than independently verified AI-caused layoffs.
- 116,175 announced U.S. job cuts were attributed to AI by employers from January through August 2026.
- 529,914 job cuts were announced across all reasons during the same January–August period.
- 3,462 announced job cuts were attributed to AI in August 2026 alone.
These figures should not be interpreted as a verified count of completed layoffs caused solely by AI. Announced reductions may occur over time, and employer attribution does not independently establish causality.
Source: Challenger, Gray & Christmas – August 2026 Job Cuts Report.
AI May Be Affecting Hiring Before Layoffs
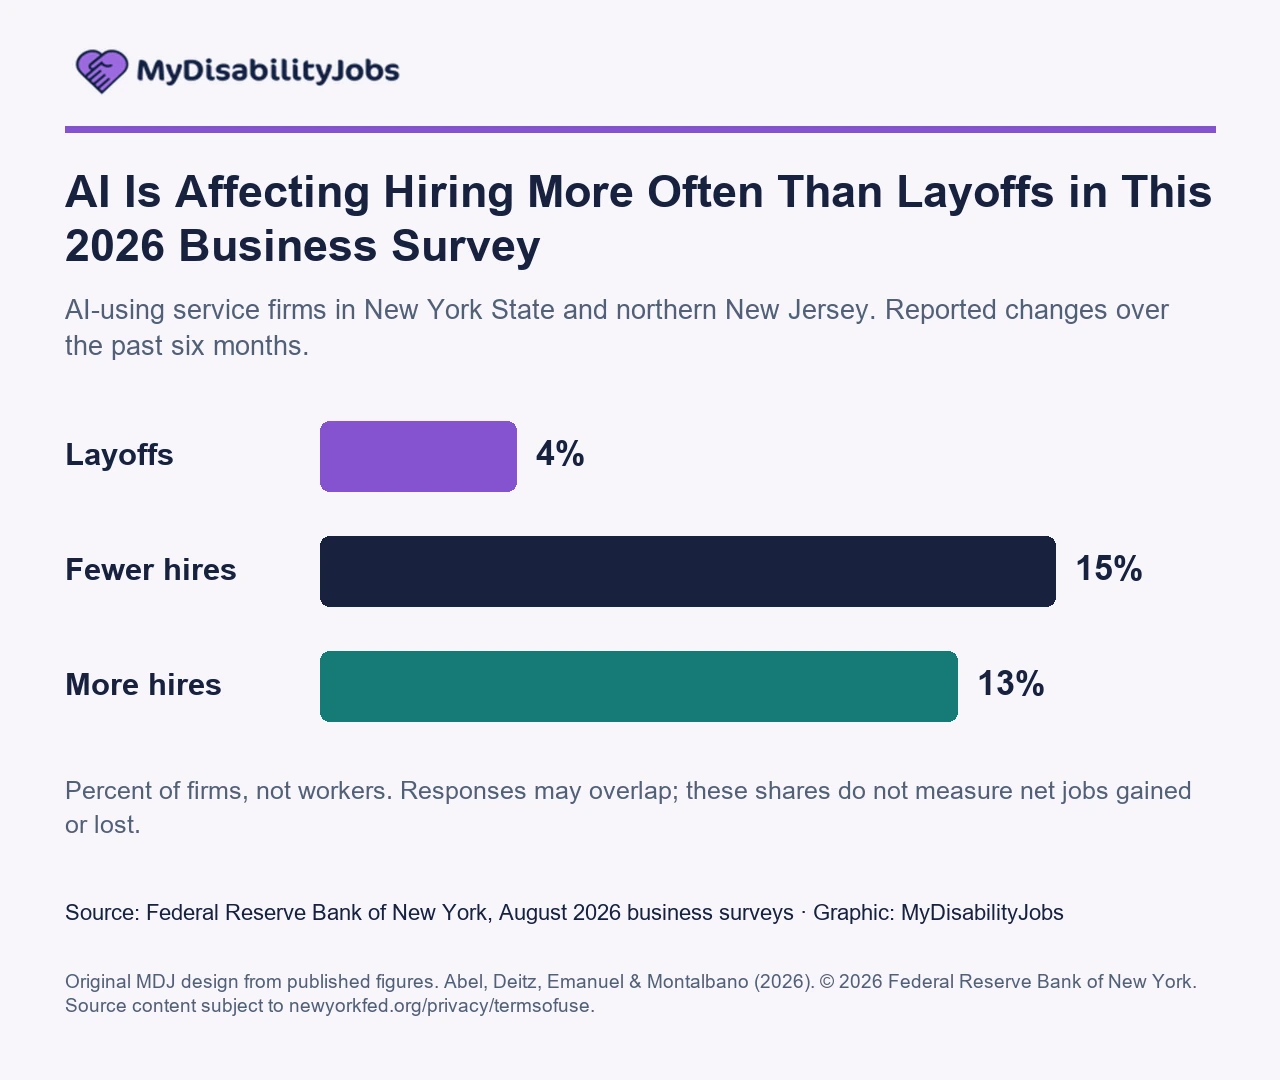
Early evidence suggests that AI-related labor-market effects may appear through slower hiring and fewer job openings before they appear as layoffs.
- Among AI-using service firms, 15% reported fewer hires, compared with 4% reporting AI-related layoffs and 13% reporting more hires. These percentages refer to firms, not workers.
- Employment among highly exposed U.S. workers aged 22–25 was 19% below the path implied by keeping pace with less-exposed peers, with the difference driven mainly by weaker hiring rather than increased separations.
- Among workers aged 20–24, weaker employment in highly exposed occupations was more consistent with slower entry into work than with increased flows into unemployment.
- A 10-percentage-point higher automatable-task share was associated with approximately 5% fewer job postings by the end of 2023 and 8% fewer by Q1 2025. These figures measure vacancies, not layoffs or filled jobs.
The evidence is not uniform or fully causal. The 19% estimate is observational, some trends diverged before widespread GenAI adoption, and the employer survey is regional rather than nationally representative.
Sources: Stanford Digital Economy Lab / ADP; Federal Reserve Bank of Dallas — CPS analysis; Federal Reserve Bank of Dallas — Lightcast analysis; Federal Reserve Bank of New York.
AI and Younger Workers: What the Evidence Shows So Far
Younger workers appear to be one of the groups where early AI-related labor-market pressure is most visible, particularly through weaker hiring and job entry rather than higher job-loss rates.
- Multiple studies point to weaker employment or job-finding outcomes among younger workers in more AI-exposed occupations.
- A separate analysis found tentative weakness of about 14% in job finding among exposed workers aged 22–25 relative to its comparison benchmark.
- These findings do not show that AI has eliminated a fixed percentage of entry-level jobs.
- Age groups such as 20–24 or 22–25 should not be treated as equivalent to graduates or formally defined entry-level roles.
Sources: Stanford Digital Economy Lab / ADP; Federal Reserve Bank of Dallas — CPS analysis; Anthropic.
What Observed Labor-Market Evidence Shows So Far
The studies below measure different outcomes, including announced cuts, payroll employment, labor-market entry, job postings, employer-reported staffing changes, wages, and recorded hours. Their estimates should therefore be compared with their populations, geographies, and time periods attached rather than added together.
| Study / geography | Period | Outcome and main finding | Evidence type | Key limitation |
|---|---|---|---|---|
| Challenger / U.S. | Jan–Aug 2026 | 116,175 employer-attributed announced cuts citing AI. | Employer-attributed announcements | Not confirmed realized layoffs or independently verified causal effects. |
| Stanford / ADP / U.S. | Through June 2026; August revision | 19% relative employment shortfall among exposed workers ages 22–25, driven mainly by weaker hiring. | Observed payroll analysis | Education controls, pretrends, and sample composition matter. |
| Dallas Fed / CPS / U.S. | Through September 2025; published January 2026 | Weaker labor-market entry among younger workers in exposed occupations. | Observed household-survey flows | Small subgroup samples; age is not equivalent to entry-level status. |
| Dallas Fed / Lightcast / Texas | End-2023 and Q1 2025 comparisons | 5% to 8% fewer postings per 10-percentage-point higher automatable-task share. | Observed postings linked to exposure | Vacancies are not filled jobs or layoffs; regional data. |
| New York Fed / New York and northern New Jersey | August 2026; prior six months | AI-using service firms reported 4% layoffs, 15% fewer hires, and 13% more hires. | Survey-reported employer effects | Firm shares; self-reported; not nationally representative. |
| Yale Budget Lab / U.S. | Through Q1 2026 | No clear statistically or economically significant aggregate employment or wage effect in its framework. | CPS with synthetic difference-in-differences | Broad averages can mask subgroup effects; identification assumptions remain. |
| Humlum & Vestergaard / Denmark | Records through December 2024; March 2026 paper | Task reorganization without large measured effects on earnings or recorded hours over the studied horizon. | Surveys linked to administrative records | Danish occupations and institutions; limited time horizon. |
- The Danish study linked approximately 25,000 workers across 7,000 workplaces to administrative records and found substantial task reorganization without large measured effects on earnings or recorded hours over the period studied.
- Across the studies, the emerging picture is not one uniform employment shock. Effects appear through announced cuts, hiring, job entry, vacancies, task organization, and aggregate labor-market outcomes.
Sources: Challenger, Gray & Christmas; Stanford Digital Economy Lab / ADP; Federal Reserve Bank of Dallas — CPS analysis; Federal Reserve Bank of Dallas — Lightcast analysis; Federal Reserve Bank of New York; Yale Budget Lab; Humlum & Vestergaard.
AI Exposure Is Not the Same as Job Replacement
AI exposure measures how much of a job’s tasks could be affected by AI. It does not show that the job will disappear.
- Around one-quarter of global employment has some exposure to generative AI, while 3.3% falls into the highest exposure category.
- Around 40% of global employment is exposed to AI, rising to roughly 60% in advanced economies, compared with 40% in emerging markets and 26% in low-income economies.
- 27% of jobs across the OECD economies covered are in occupations at high risk of automation. This measure includes broader automation technologies as well as AI.
- U.S. BLS data classify 831 detailed occupations into four relative AI exposure categories. These categories are not replacement probabilities and are separate from employment projections.
- In a study of 53.5 million U.S. job postings and 2,884 skills, 26% of postings were classified as highly exposed to GenAI transformation, 54% as moderately exposed, and 20% as minimally exposed.
- Only 19 of 2,884 skills — 0.7% — were rated fully transformable, showing that high exposure does not usually mean every task in a job can be automated.
Sources: ILO; IMF; OECD; U.S. Bureau of Labor Statistics — AI exposure categories; U.S. Bureau of Labor Statistics — employment projections; Indeed Hiring Lab.
Which Jobs Are Most Exposed to AI?
AI exposure is generally highest in occupations built around digital information, analysis, writing, documentation, and other tasks that current AI systems can perform or assist with.
- Clerical and administrative occupations consistently appear among the most exposed categories in major AI-exposure frameworks.
- Higher exposure also appears in information-processing, writing, analytical, finance, accounting, software, data, and some professional-services tasks.
- Exposure varies substantially within occupations because jobs combine different tasks, some of which may be highly exposed while others still require human judgment, interaction, accountability, or physical work.
- High exposure does not mean an occupation will disappear. AI may automate some activities, assist workers with others, or change the mix of tasks performed within the same job.
Sources: ILO; U.S. Bureau of Labor Statistics — AI exposure categories; Indeed Hiring Lab.
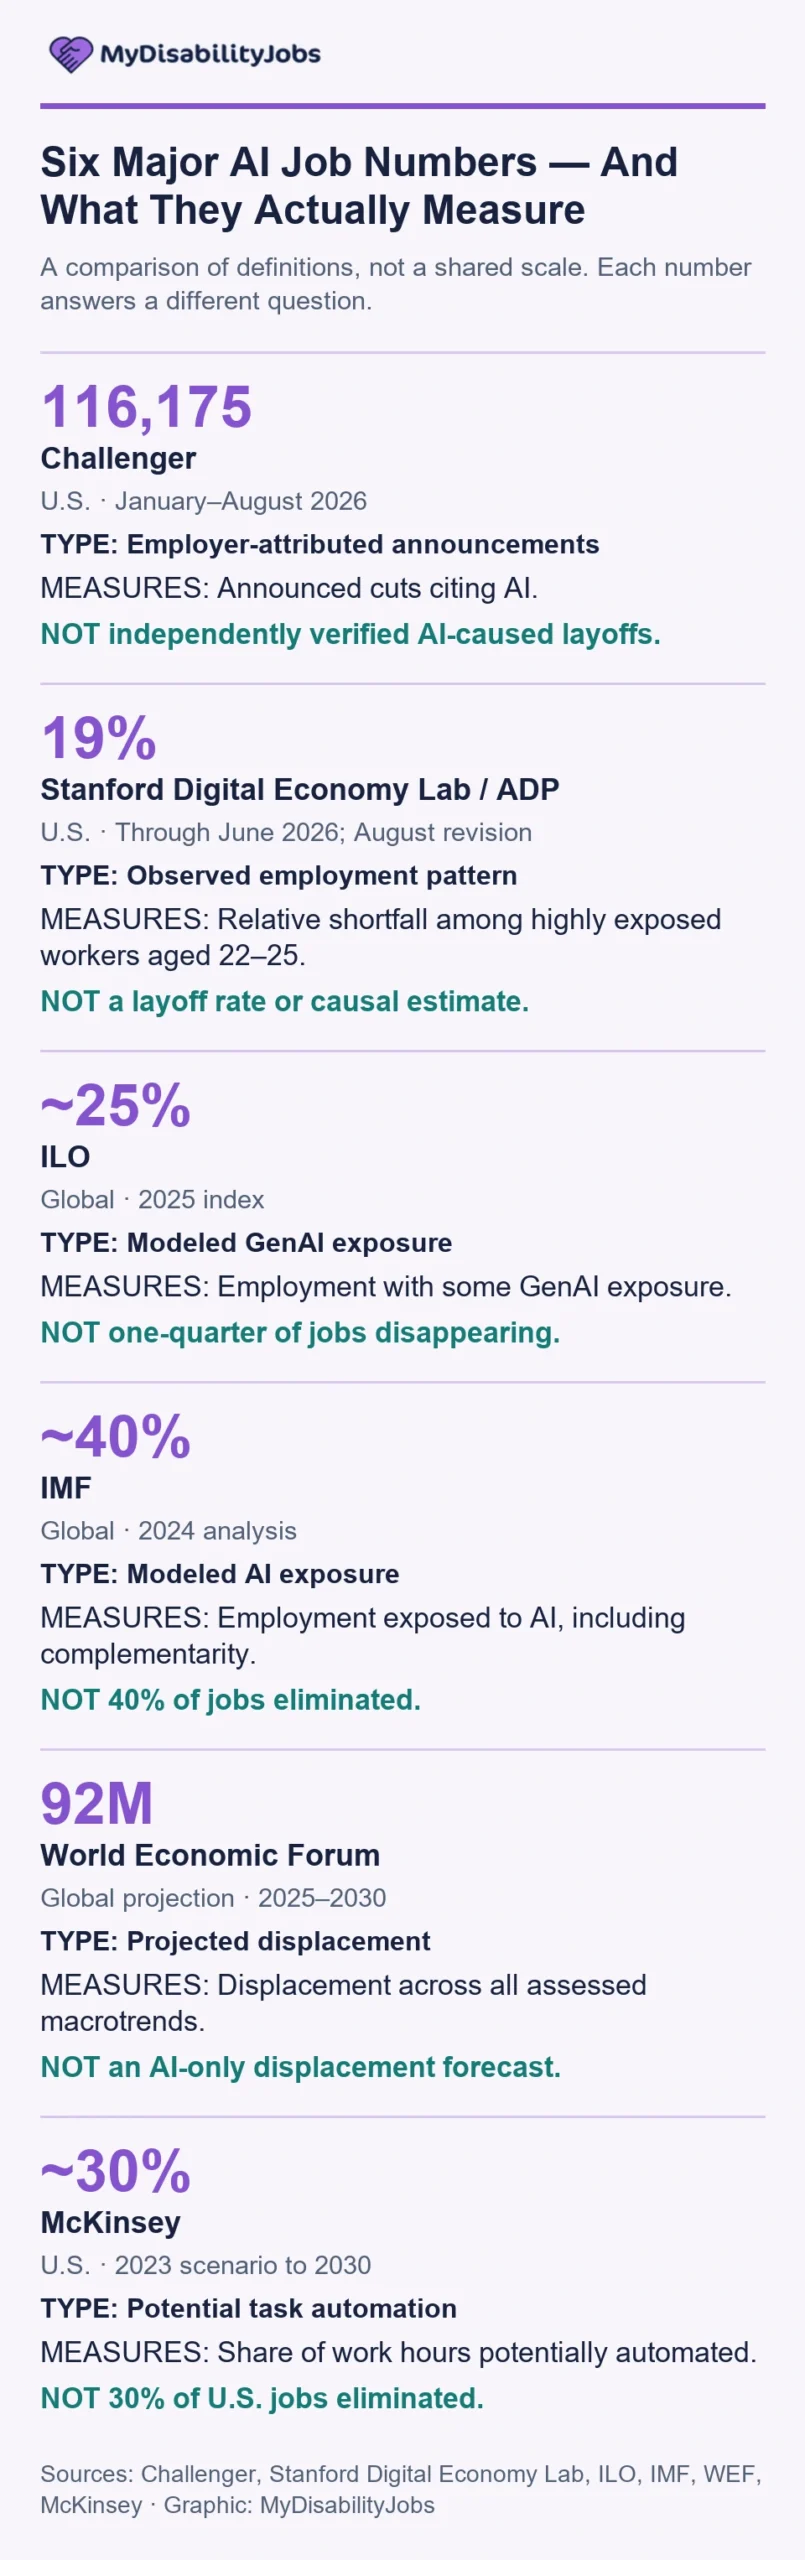
Exposure, Automation Potential, and Job Loss Measure Different Things
| Metric | Published example | How to interpret the number |
|---|---|---|
| AI exposure | ~25% of global employment | The denominator is employment classified by tasks. This does not count people who have already lost their jobs. |
| Automation potential | ~30% of U.S. work hours by 2030 | The unit is hours within jobs, not complete jobs. Employers may automate some activities while retaining a role. |
| Job-posting exposure | 26% of U.S. postings highly exposed | The denominator is advertised vacancies in the study sample, not the stock of employed workers. |
| Employer-attributed cuts | 116,175 U.S. announcements through August 2026 | This measures employer-stated AI reasons for planned cuts. It does not independently verify realization or causality. |
| Observed employment change | 19% relative shortfall among exposed workers ages 22–25 | A shortfall can emerge from fewer hires, not only from higher layoff rates. |
| Projected displacement | 92 million globally by 2030 | This estimate sits inside a broader forecast framework that also projects 170 million job creation and a net gain of 78 million. |
- Exposure estimates show where AI may affect tasks, not how many jobs have already disappeared.
- Automation potential measures the share of activities that could be automated, not the number of workers who will necessarily be replaced.
- Employer-attributed cuts, observed employment change, and long-term forecasts each answer different questions and should not be added together.
Sources: ILO; McKinsey; Indeed Hiring Lab; Challenger, Gray & Christmas; Stanford Digital Economy Lab / ADP; World Economic Forum.
How Many Jobs Could AI Replace by 2030?
There is no single reliable number. Estimates vary depending on whether a study models tasks, working hours, occupational transitions, displaced positions, or net employment—and whether it isolates AI or includes broader economic forces.
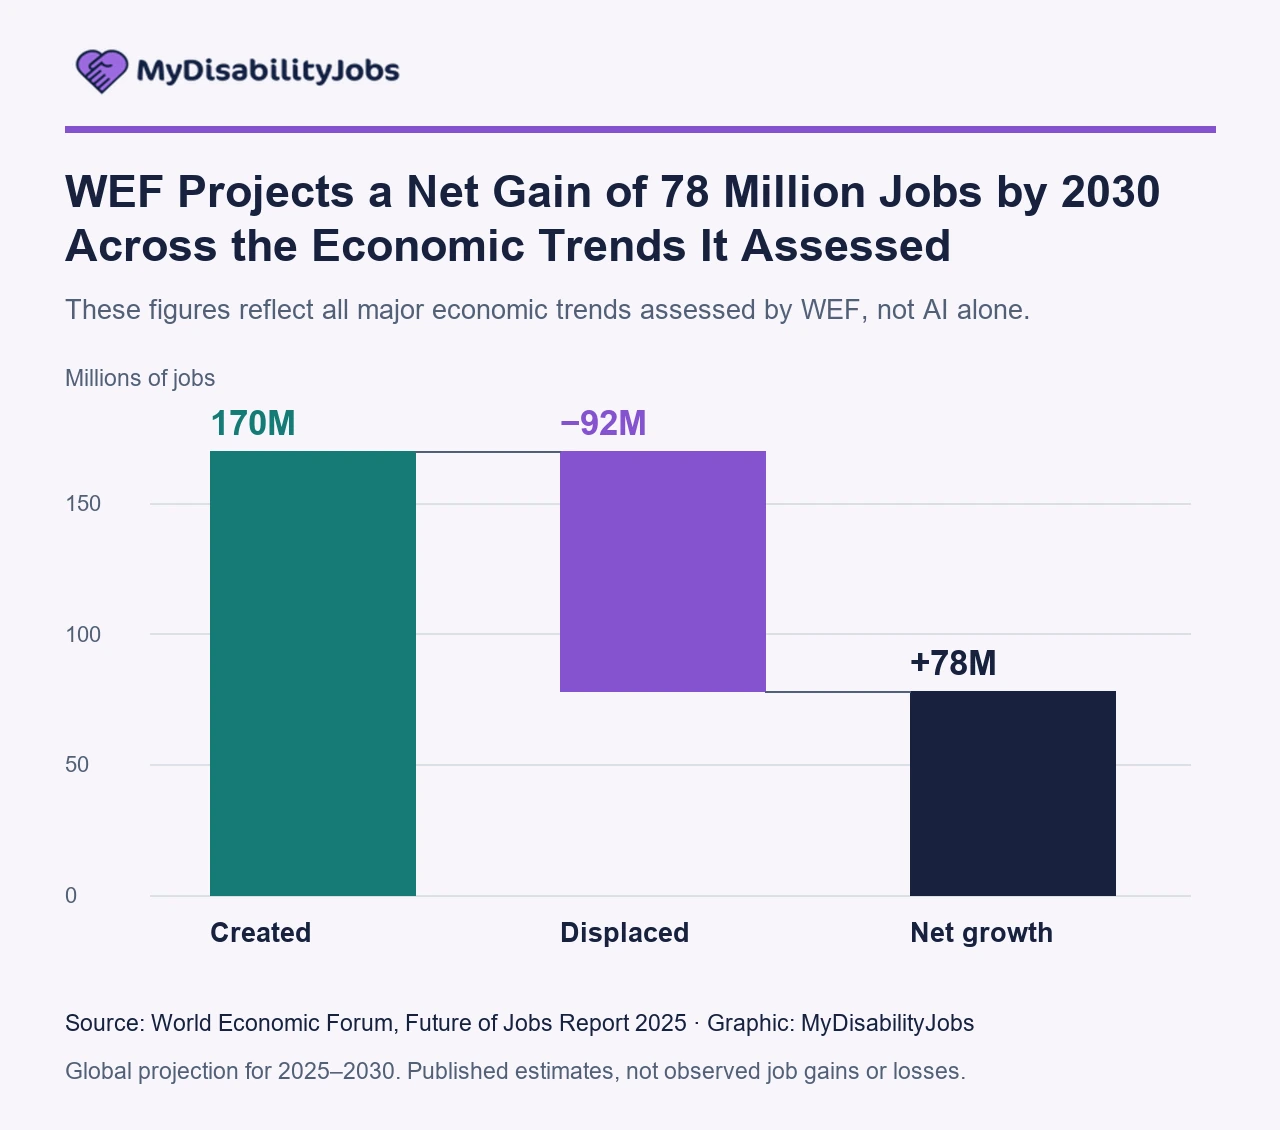
- 170 million jobs are projected to be created and 92 million displaced by 2030 across all assessed macrotrends, producing a net gain of 78 million jobs.
- The forecast draws on more than 1,000 employers representing over 14 million workers across 55 economies and 22 industry clusters.
- Activities accounting for about 30% of U.S. work hours could potentially be automated by 2030.
- Around 12 million additional occupational transitions are modeled through 2030 across the economic drivers included in the U.S. scenario.
- These figures should not be interpreted as direct AI-only job-loss totals. The 92 million displacement estimate covers multiple macrotrends, while automation of work hours does not mean the same share of jobs will disappear.
- Exposure estimates from the ILO, IMF, and OECD also do not provide a dated count of jobs that AI will eliminate by 2030.
Forecasts remain highly sensitive to assumptions about AI capabilities, adoption speed, economic demand, productivity, and worker transitions.
Sources: World Economic Forum; McKinsey; ILO; IMF; OECD.
Major AI and Automation Employment Estimates Compared
Major AI employment estimates are often quoted side by side even though they measure different things. Some estimate exposure, others model automation potential, occupational transitions, or broader job creation and displacement.
| Source / geography | Horizon or period | Main estimate | What it measures | What it does NOT mean |
|---|---|---|---|---|
| ILO / Global | 2025 index | ~25% exposed; 3.3% in highest category | Modeled GenAI exposure | One-quarter of jobs disappearing. |
| IMF / Global | 2024 analysis | ~40% exposure | AI exposure, including complementarity | 40% of jobs eliminated. |
| OECD / Covered OECD economies | 2023 report | 27% in high-risk occupations | Broader automation risk | 27% of jobs replaced by GenAI. |
| World Economic Forum / Global | 2025–2030 | 170M created; 92M displaced; +78M net | Job creation and displacement across all assessed macrotrends | AI-only job gains or losses. |
| McKinsey / U.S. | Scenario to 2030 | ~30% of work hours; ~12M transitions | Potential task automation and occupational transitions | 30% of jobs disappearing or 12M AI layoffs. |
| Frey & Osborne / U.S. | Historical 2013, pre-GenAI | 47% high susceptibility | Occupational susceptibility to computerisation | 47% of jobs gone by 2030. |
- These estimates should not be averaged into a single “AI job-loss forecast.”
- Exposure, automation potential, occupational transitions, and projected displacement use different units and assumptions.
- Older estimates, especially the 2013 Frey–Osborne figure, should be treated as historical benchmarks rather than current GenAI forecasts.
Sources: ILO; IMF; OECD; World Economic Forum; McKinsey; Frey & Osborne / Oxford.
Commonly Misquoted AI Job Statistics
- Misquote: “One in four jobs will disappear because of GenAI.”
- Correction: Around one-quarter of global employment has some GenAI exposure, while 3.3% falls into the highest exposure category. Exposure is not a measured job-loss rate.
- Misquote: “The IMF says AI will eliminate 40% of jobs.”
- Correction: The 40% figure refers to global employment exposure to AI and explicitly includes work where AI may complement workers rather than replace them.
- Misquote: “AI will eliminate 92 million jobs by 2030.”
- Correction: The 92 million displacement projection covers all assessed macrotrends, not AI alone. The same framework projects 170 million jobs created and a net gain of 78 million.
- Misquote: “AI has already laid off 19% of young workers.”
- Correction: The 19% figure is a relative employment shortfall among highly exposed workers aged 22–25, driven mainly by weaker hiring rather than increased separations.
- Misquote: “AI caused 116,175 verified U.S. layoffs.”
- Correction: The 116,175 figure refers to employer-attributed announced job cuts citing AI through August 2026, not independently verified completed layoffs caused solely by AI.
- Misquote: “27% of jobs will be replaced by GenAI.”
- Correction: The 27% figure refers to occupations at high risk from broader automation technologies, not a GenAI-specific replacement forecast.
- Misquote: “Oxford predicted 47% of jobs would be gone by 2030.”
- Correction: The 47% figure measured occupational susceptibility to computerisation in a pre-GenAI framework. It was not a forecast that 47% of jobs would disappear by 2030.
Sources: ILO; IMF; World Economic Forum; Stanford Digital Economy Lab / ADP; Challenger, Gray & Christmas; OECD; Frey & Osborne / Oxford.
Why Forecasts Differ So Much
AI employment forecasts vary because studies measure different things and rely on different assumptions. A task is not the same as an occupation, and an occupation is not the same as an individual worker.
- Some studies measure technical exposure, while others model automation potential, occupational transitions, job creation, or job displacement.
- Adoption rates depend on cost, reliability, regulation, employer strategy, and how quickly organizations redesign work around AI.
- Productivity gains can reduce labor needs per unit of output while also increasing demand, creating new products, or changing the mix of jobs.
- Results also vary by country, industry, time horizon, and the AI capabilities available when each model was developed.
- Estimates that cover AI alone should not be compared directly with forecasts that include broader economic trends.
- These studies should not be averaged into a synthetic “consensus job-loss estimate.” Their units, assumptions, populations, and horizons are not compatible.
Sources: ILO; IMF; OECD; World Economic Forum; McKinsey; Frey & Osborne / Oxford.
What Can We Conclude About AI Job Displacement in 2026?
AI is already affecting parts of the labor market, but the available evidence does not show one uniform employment effect across industries, occupations, or worker groups.
- Employers have explicitly attributed some announced job cuts to AI.
- Hiring and job entry appear to be important early channels of labor-market change, particularly for some younger workers in more AI-exposed occupations.
- Job postings have weakened more in occupations with a higher share of automatable tasks in some datasets.
- Exposure to AI is much broader than observed job displacement. A job can be highly exposed while still remaining in demand or being reorganized rather than eliminated.
- Aggregate U.S. evidence has not yet established a large, economy-wide employment or wage effect that can be cleanly attributed to AI.
- There is still no authoritative national total of jobs that have been causally eliminated by AI.
- The clearest conclusion in 2026 is therefore that AI is changing hiring, tasks, vacancies, and some employer staffing decisions, but the scale of realized displacement remains much harder to measure than headline exposure or forecast figures suggest.
Sources: Challenger, Gray & Christmas; Stanford Digital Economy Lab / ADP; Federal Reserve Bank of New York; Yale Budget Lab; Humlum & Vestergaard.
Data Limitations
There is still no national dataset that can cleanly identify all jobs causally eliminated by AI. Doing so would require verified employer AI deployment, realized worker separations, and a credible way to distinguish AI effects from other economic forces.
- Identification: Employment can change because of demand, interest rates, industry cycles, restructuring, and other technologies alongside AI adoption.
- Measurement and samples: Payroll data, job postings, employer surveys, and household surveys measure different populations and outcomes.
- Young-worker evidence: Age groups such as 20–24 or 22–25 are useful for studying labor-market entry, but they are not the same as graduates or formally defined entry-level roles.
- Generalizability: Regional U.S. surveys, Danish administrative evidence, and provider-specific AI usage data should not automatically be generalized to all workers or labor markets.
- Overlapping evidence: Different studies may rely on the same underlying datasets or exposure measures, so similar findings do not always represent independent replication.
- Time horizon: Most observed GenAI labor-market evidence still covers a relatively short period, while longer-term forecasts depend heavily on assumptions about adoption, productivity, demand, and worker transitions.
- Technology vintage: AI capabilities are changing quickly, so studies based on different model generations or time periods are not always directly comparable.
Sources: Stanford Digital Economy Lab / ADP; Federal Reserve Bank of Dallas — CPS analysis; Federal Reserve Bank of Dallas — Lightcast analysis; Humlum & Vestergaard; Anthropic; World Economic Forum; McKinsey.
Methodology and Source Selection
Research library verified September 27, 2026. This article prioritizes primary and high-authority evidence, including government datasets, peer-reviewed research, university studies, major institutional reports, and original labor-market data.
- We reviewed original publications rather than relying on secondary statistics roundups whenever the primary source was available.
- Geography, sample population, data period, and study scope were preserved when reporting statistics.
- Observed outcomes, employer-reported effects, modeled AI exposure, automation potential, and future projections were treated as separate types of evidence.
- Where newer versions of a study were available, the most recent verified version was used. This includes the August 2026 revision of the Stanford / ADP analysis.
- Statistics from different studies were not added together or averaged when their populations, units, methodologies, or time horizons were incompatible.
- MyDisabilityJobs graphics were created from published factual data using original designs rather than reproducing source artwork.
- The research library is curated for editorial use and should not be interpreted as a formal exhaustive systematic review of every study on AI and employment.
Frequently Asked Questions
There is no authoritative national count of all jobs causally eliminated by AI. Announced cuts, payroll changes, hiring patterns and exposure estimates measure different things and cannot be combined into one verified total.
Challenger recorded 116,175 U.S. employer-attributed announced cuts citing AI from January through August 2026. This is not a full-year total or a count of independently verified, realized AI-caused layoffs.
There is no single reliable AI-only total. WEF projects 92 million jobs displaced and 170 million created across all assessed macrotrends by 2030. McKinsey models potential automation of about 30% of U.S. work hours, not elimination of that share of jobs.
That is not what the IMF estimate says. Around 40% of global employment is exposed to AI, including work that AI could complement as well as substitute for. Exposure is not a replacement probability.
No. The WEF projection covers displacement across all assessed macrotrends, not AI alone. Its corresponding job-creation projection is 170 million, for net growth of 78 million by 2030.
Stanford, Dallas Fed and Anthropic analyses show signs of weaker hiring or job entry among younger workers in more-exposed occupations. These observational findings do not establish that AI eliminated a fixed percentage of entry-level jobs, and age is not equivalent to entry-level status.
Exposure research often identifies clerical, administrative, information-processing, writing, analytical and some software or professional-services tasks. Being exposed can mean receiving AI assistance or having tasks reorganized; it does not prove the whole job will disappear.
Comments are closed