
Deaf Employment Statistics | Updated 2024
Today we will understand more about hearing disabilities, the facts, and statistics related to hearing impairment, the employability of people with this type of disability, and the overall picture of living with hearing loss or deafness.
According to the WHO hearing loss is when you are not able to hear as well as a person whose sense of hearing is normal, i.e. whose hearing threshold in both ears is equal to or better than 20 dB.
With this definition in mind, let’s move to:
–Global hearing impairment statistics
–Statistics of hearing loss employment in the United States
Is your company offering jobs for people with disabilities? As an employer, you can publish your job offers on MyDisabilityJobs and reach thousands of qualified candidates.
Deaf Employment Statistics (Editors Picks)
- In the US, one out of eight people aged 12 years or older has hearing loss in both ears. This is 13% of the population, or 30 million.
- Due to unsafe hearing practices, more than 1 billion young adults are at risk of suffering avoidable and permanent hearing loss.
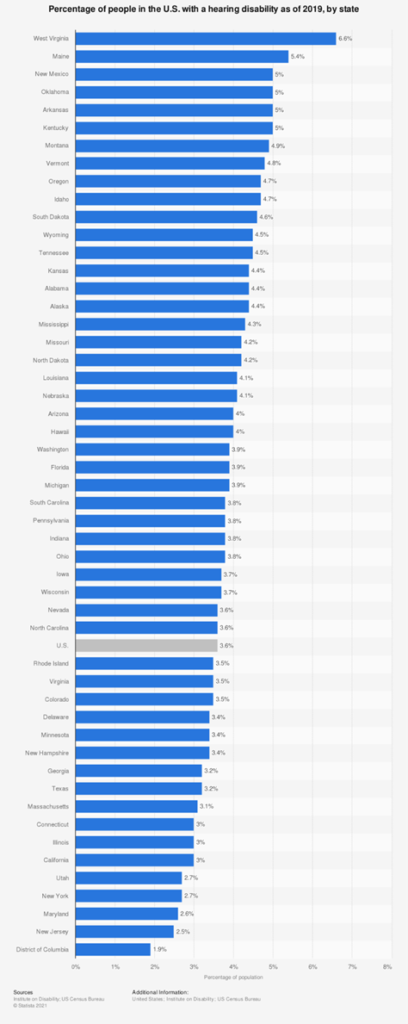
- West Virginia is the state in the US with the most people affected by hearing disabilities.
- Employment rates for deaf people have not increased from 2008 to 2017 in the US.
- Deaf women earn 77 cents for each dollar that deaf men earn while hearing women earn 83 cents for each dollar that hearing men earn.
- Only 44.8% of deaf African Americans and 43.6% of deaf Native Americans are in the labor force, compared to 59% of deaf Whites.
- Employment rates of deaf people increase as their educational attainment increases: about 40% more from those who did not complete high school education, to those who finish a master’s degree.
Sources: WHO, National Deaf Center.
Global hearing impairment statistics
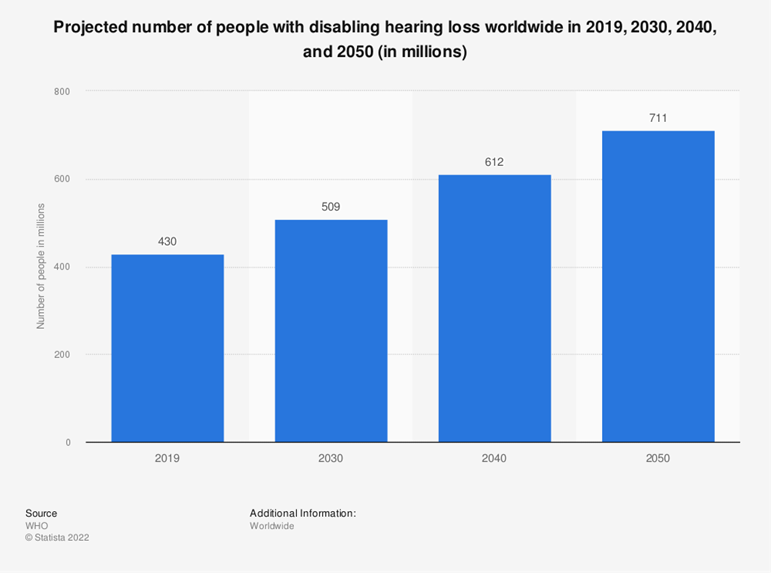
- Worldwide, 1.5 billion people live with some degree of hearing loss, of whom some 430 million are in need of rehabilitation services.
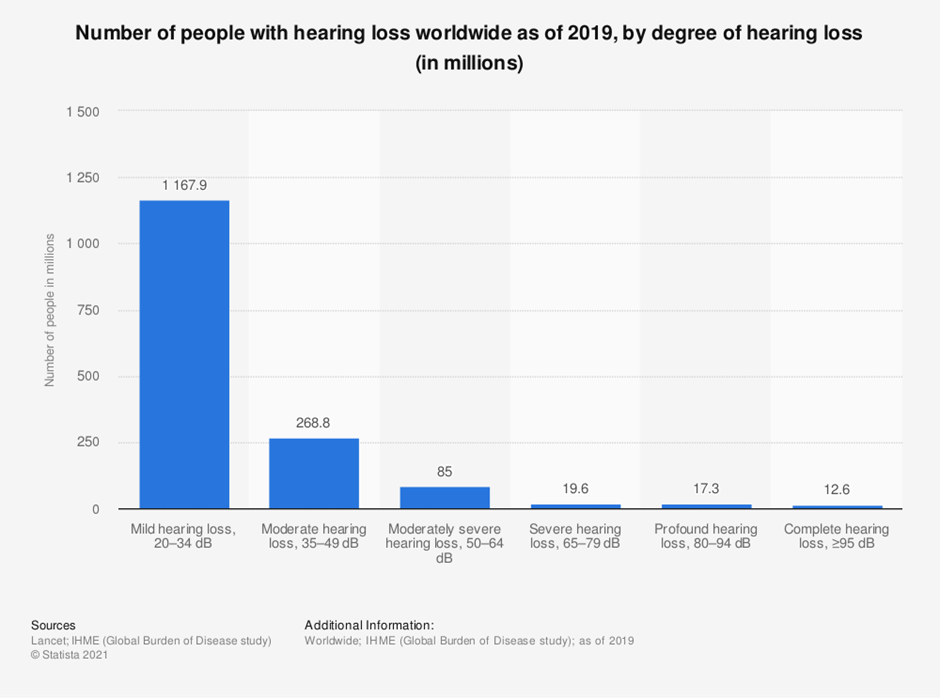
- By 2050, nearly 2.5 billion people are expected to have some degree of hearing loss and at least 700 million will require rehabilitation.
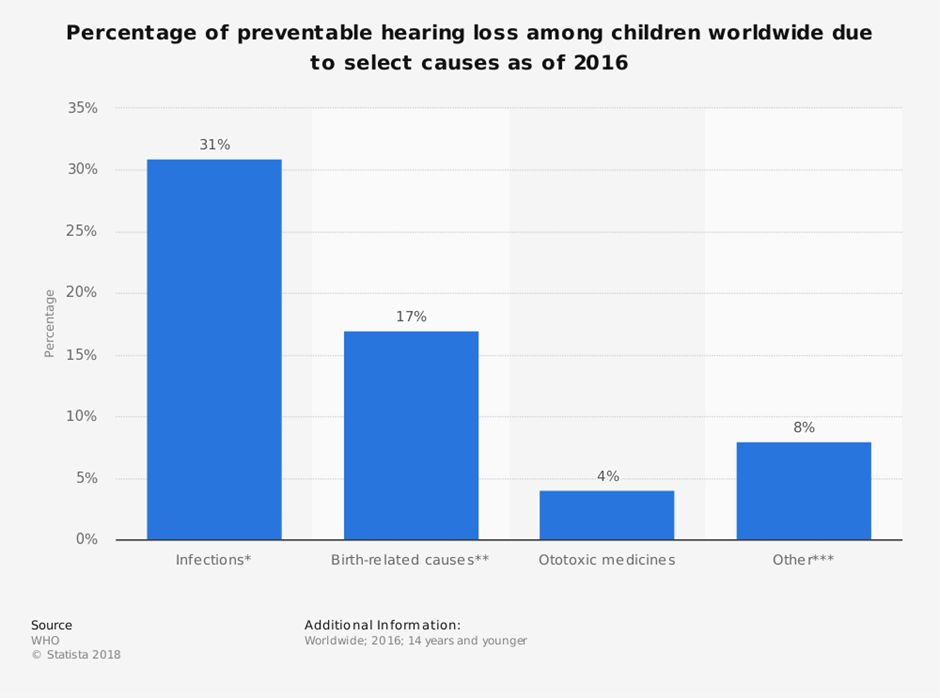
- In children, almost 60% of hearing loss is due to causes such as otitis and congenital complications that can be prevented by public health measures.
- Due to unsafe hearing practices, more than 1 billion young adults are at risk of suffering avoidable and permanent hearing loss.
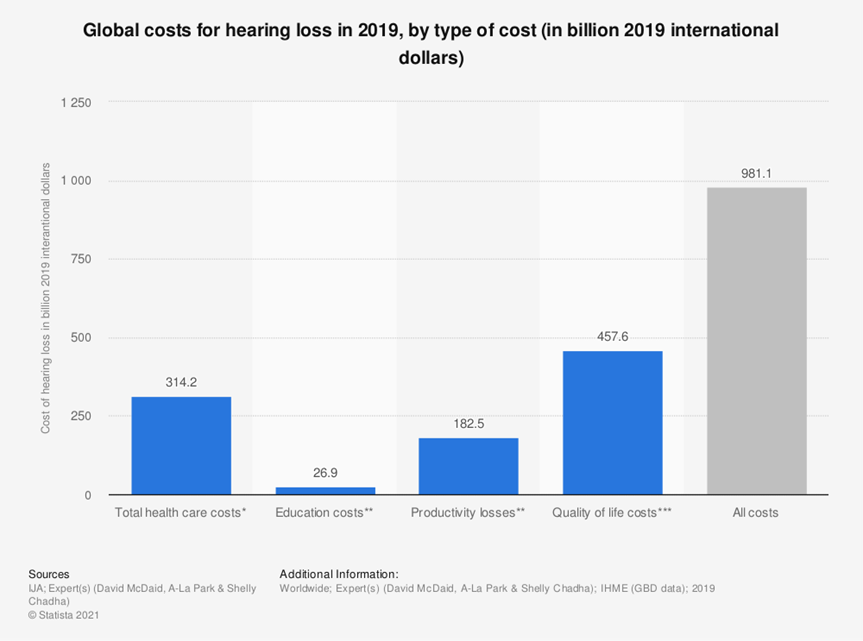
- Untreated hearing loss generates significant costs to communities around the world and costs governments US$ 980 billion annually. Interventions to prevent, detect and treat hearing loss are cost-effective and can be of great benefit to individuals.
- Only 17% of all people who could benefit from using a hearing aid wear one. The percentage of people who do not wear one is almost equally high in all parts of the world (ranging from 77% to 83% among WHO regions and 74% to 90% depending on income levels).
- Expanding otological and audiological care services worldwide only requires an additional annual investment of less than US$ 1.40 per person.
- After 10 years, the return on investment would be almost US$ 16 for every dollar invested.
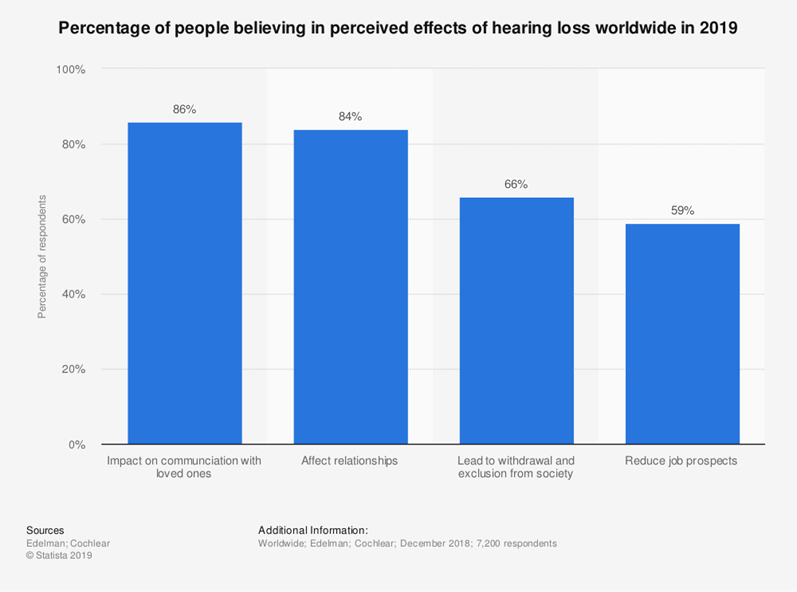
- Hearing loss generates social and economic impacts. Eighty-six percent of hearing-impaired people have felt the impact of their condition on communication with loved ones. And almost 60% have perceived a loss of competitiveness in the labor market.
Sources: Coclear, International Journal of Audiology, WHO, Lancet.
Statistics of hearing loss in the United States
Here are some of the key data of the US landscape on hearing loss:
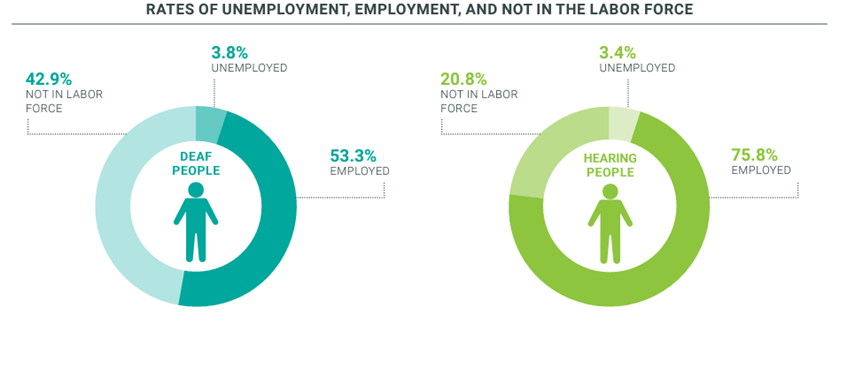
- 53% of deaf people were employed in 2017. This is an employment gap of 22.5% for hearing people.
- Deaf people are actively looking for work to a greater extent than hearing people.
- A large percentage of deaf people are not in the labor force.
- Deaf people who are employed full-time report median earnings that are comparable to hearing people.
- Employment rates for deaf people have not increased from 2008 to 2017.
- Educational attainment appears to narrow employment gaps.
- Deafdisabled people are most likely to experience pay inequality and underemployment.
But let’s dive more into the above topics:
Employment:
- Deaf and hearing people have unemployment rates of 3.8% and 3.4%, respectively. This difference, while small, is statistically significant. This suggests that deaf people are more likely to be actively looking for work than hearing people.
- Among people who are employed, a higher percentage of deaf people than hearing people are self-employed (11.6% vs. 9.8%) or business owners (4.1% vs. 3.8%). Some experts explain this tendency due to the obstacles deaf people face and their abilities to sort them by themselves.
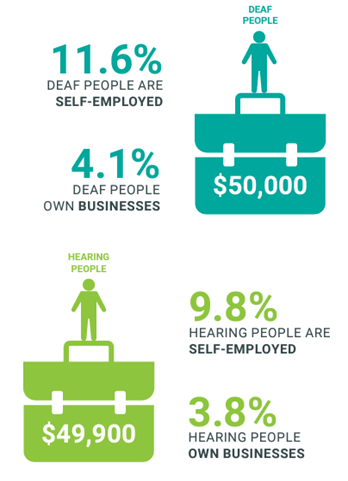
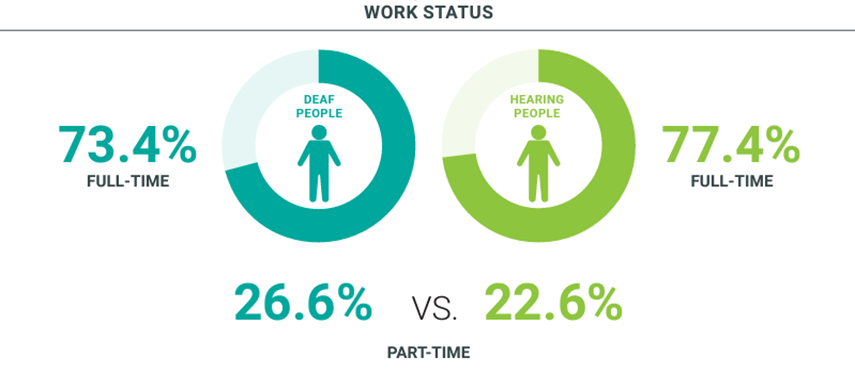
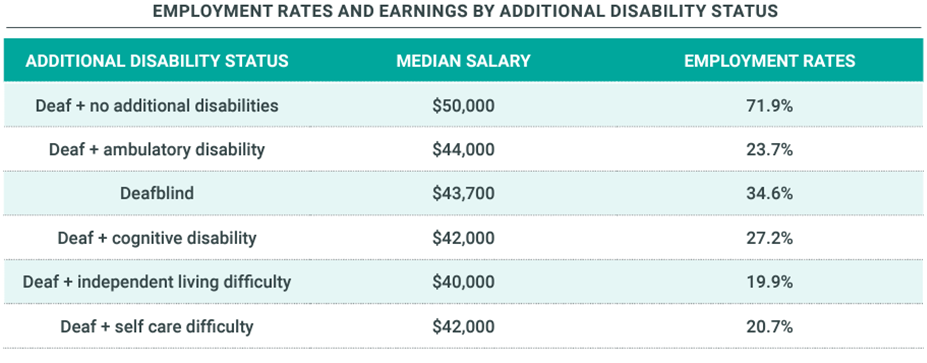
- When considering work status, deaf people are more likely to work part-time than their hearing counterparts. If deaf people work full-time, they report similar median annual earnings as their hearing peers, $50,000 and $49,900, respectively.
- Deafdisable: Only 35% of deaf disabled people reported being employed in 2017 compared to 71.9% of deaf people without disabilities, an employment gap of 36.9%. Among deaf people who worked in 2017, more deaf disabled people work part-time than deaf people without additional disabilities (33.4% vs. 23.2%).
Gender and Ethnicity:
- 61.1% of deaf men versus 50.5% of deaf women are in the labor force, a statistically significant difference. The employment gap between men and women is 11.8% among hearing people and 10.6% among deaf people.
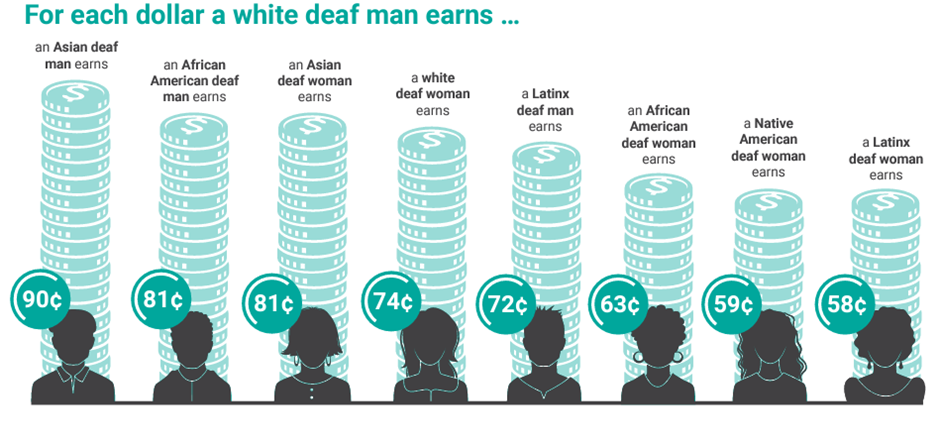
- Deaf women earn 77 cents for each dollar that deaf men earn while hearing women earn 83 cents for each dollar that hearing men earn.
- Also, only 44.8% of deaf African Americans and 43.6% of deaf Native Americans are in the labor force, compared to 59% of deaf Whites. And regarding earnings, for each dollar a white deaf person earns, a Latinx deaf woman earns 64 cents and an Asian woman earns 90 cents.
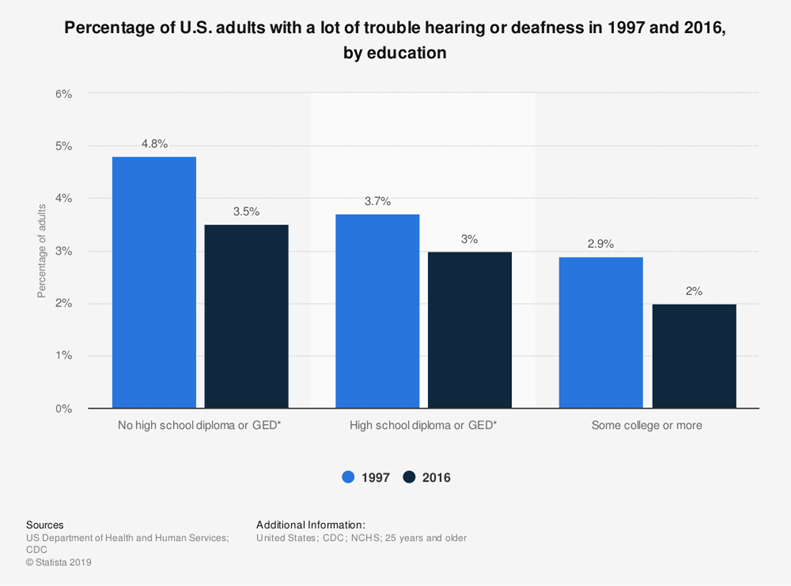
Education:
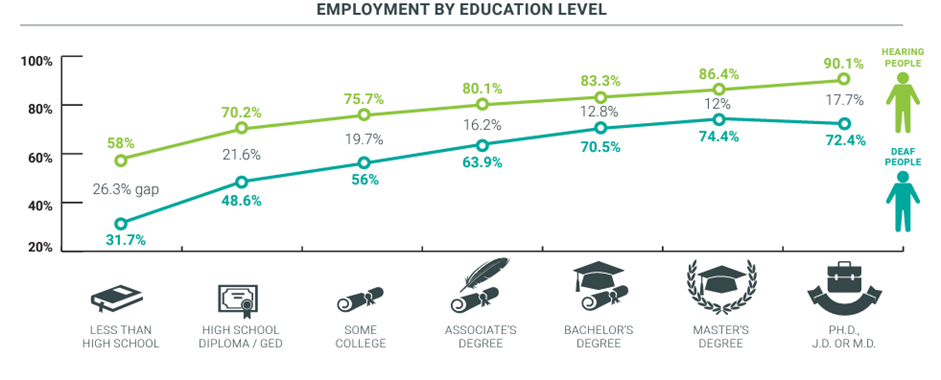
- Employment rates of deaf people increase as their educational attainment increases, from 31.7% for those who did not complete high school education, to 74.4% for those with a master’s degree. This increase in employment rates is also found in the general population.
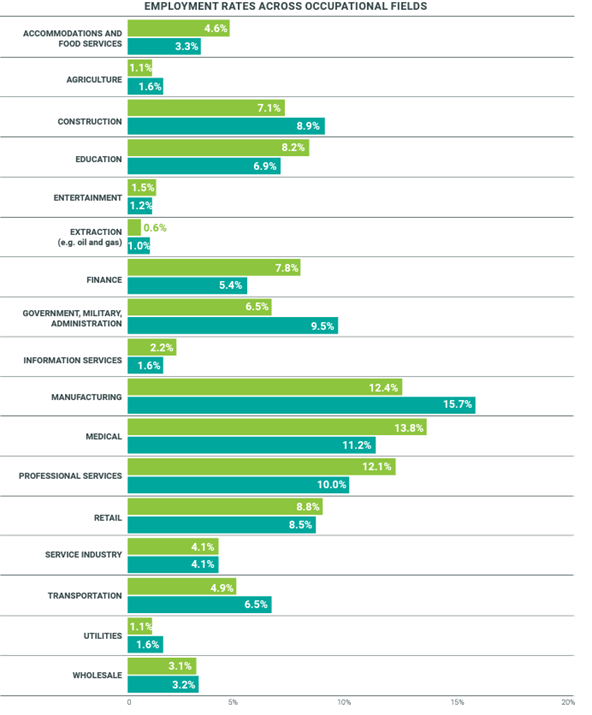
- Deaf people with degrees in the following fields: computers, mathematics, statistics, liberal arts/history, and the arts, had the highest employment rates, at over 75%. The least-employed fields were psychology and multidisciplinary studies, with employment rates of around 60%.
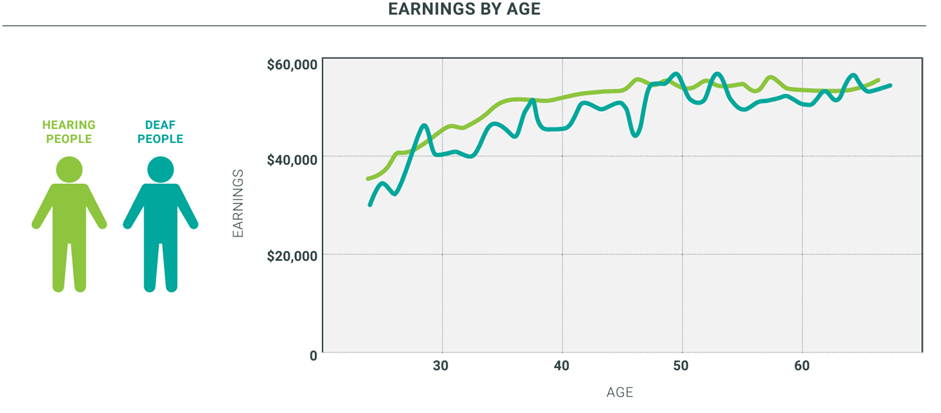
Lifespan earnings:
There is greater income instability for deaf people in the United States. earnings gains over time are significantly stronger for hearing people than for deaf people. Earnings are more strongly correlated with age for hearing people, than for deaf people. This may indicate that earnings gains related to age and experience are weaker for deaf people than for hearing people.
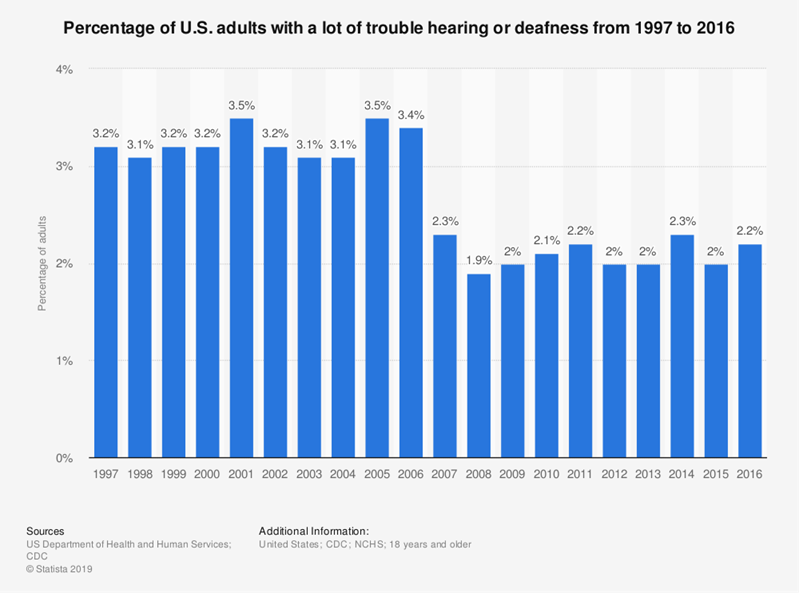
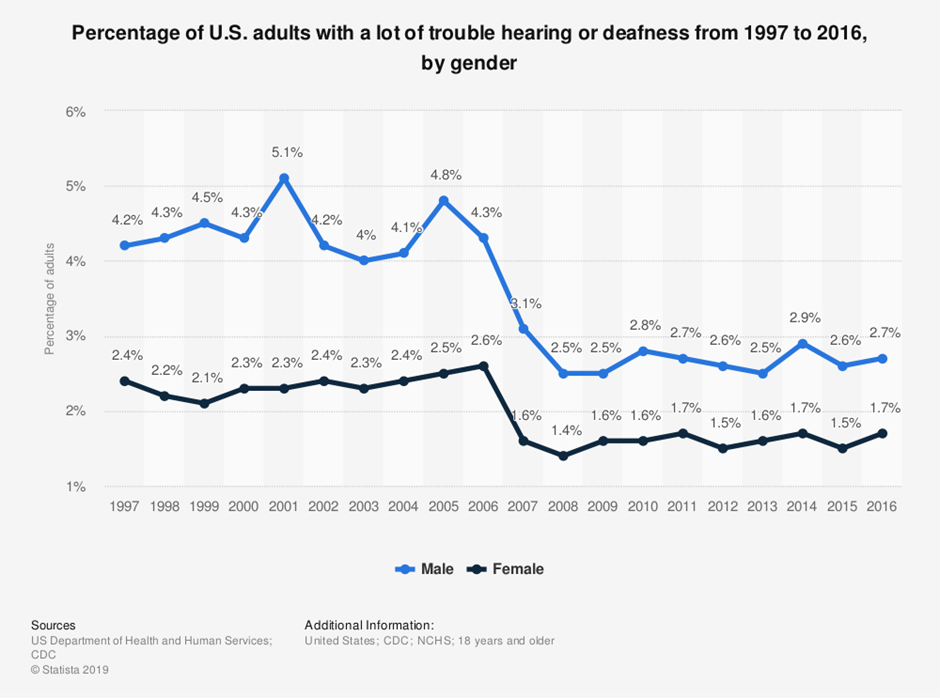
Time comparison:
The official data shows a decrease in deaf or hearing loss in the US population from 1997 to 2016. However, it does not mean it has in fact decreased, but that there is a clear difference between 2006 and 2007 due to the inclusion on the survey of the category for “moderate trouble hearing”.
These estimates are age-adjusted to the year 2000 standard population using five age groups: 18-44 years, 45-54 years, 55-64 years, 65-74 years, and 75 years and over.
- The same difference can be noticed regarding the educational attainment of the people along the time.
- Most recent data on the hearing loss population in the US shows West Virginia as the state with the most people affected by hearing disabilities with 6.6% of the population.
- Finally, the results show that men have been the most affected by hearing loss over the years. Even registering peaks of up to 5%.
Sources: National Deaf Center, CDC, US Department of Health and Human Services, US Census Bureau.
Conclusions and final thoughts
As the statistics and data show, the employability of people with hearing loss is highly affected and comparisons among the hearing population have not changed much for decades. Likewise, future projections show a negative outlook globally, which should raise alarm bells to work for hearing health and to mitigate the impact of this disability on the economic independence of individuals.
For example, by enhancing their capacity for entrepreneurship, which, as studies show, is much higher than that of the average hearing population. Hopefully, there are many jobs for deaf people or hard of hearing.
FAQ
When you are not able to hear as well as a person whose sense of hearing is normal, i.e. whose hearing threshold in both ears is equal to or better than 20 dB.
West Virginia is the State in the US with the most people affected by hearing disabilities.
In the US, one out of eight people aged 12 years or older are deaf (hearing loss in both ears). This represents 13% of the population, or 30 million.
Related article:
Neurodiversity in the Workplace Statistics
Statistics of Diversity in the Workplace
Mental Health and Employment Statistics
Disability and Depression Statistics
Disability and Employment Discrimination Statistics
Intellectual Disability Employment Statistics
Bipolar Disorder and Employment Statistics
leave your comment