


Diversity in the Workplace Statistics (2026): DEI & Workforce Data
These diversity in the workplace statistics bring together U.S. workforce demographics, diversity, equity and inclusion (DEI) surveys, and evidence on gender, race and ethnicity, LGBTQ+ experiences, and disability employment. They show who is represented at work, how employees experience inclusion, and what employers report doing.
The 2026 edition uses the latest evidence selected for this review, including earlier survey periods. Each finding identifies its data year or report edition; a 2026 title does not mean every statistic was measured in 2026. U.S. population estimates are distinguished from global employer surveys and selected corporate samples.
On this page
- Key Diversity in the Workplace Statistics — Editor's Picks
- DEI Statistics in the Workplace
- U.S. Workforce Diversity Statistics
- Gender Diversity in the Workplace Statistics
- Racial and Ethnic Diversity in the Workplace Statistics
- LGBTQ+ Workplace Diversity Statistics
- Disability Inclusion and Employment Statistics
- Employer DEI Policies and Corporate Reporting
- Benefits of Workplace Diversity — Key Statistics
- About the Data and Research Methods
- Conclusion
Is your company offering jobs for people with disabilities? As an employer, you can publish your job offers on MyDisabilityJobs and reach thousands of qualified candidates.
Key Diversity in the Workplace Statistics — Editor's Picks
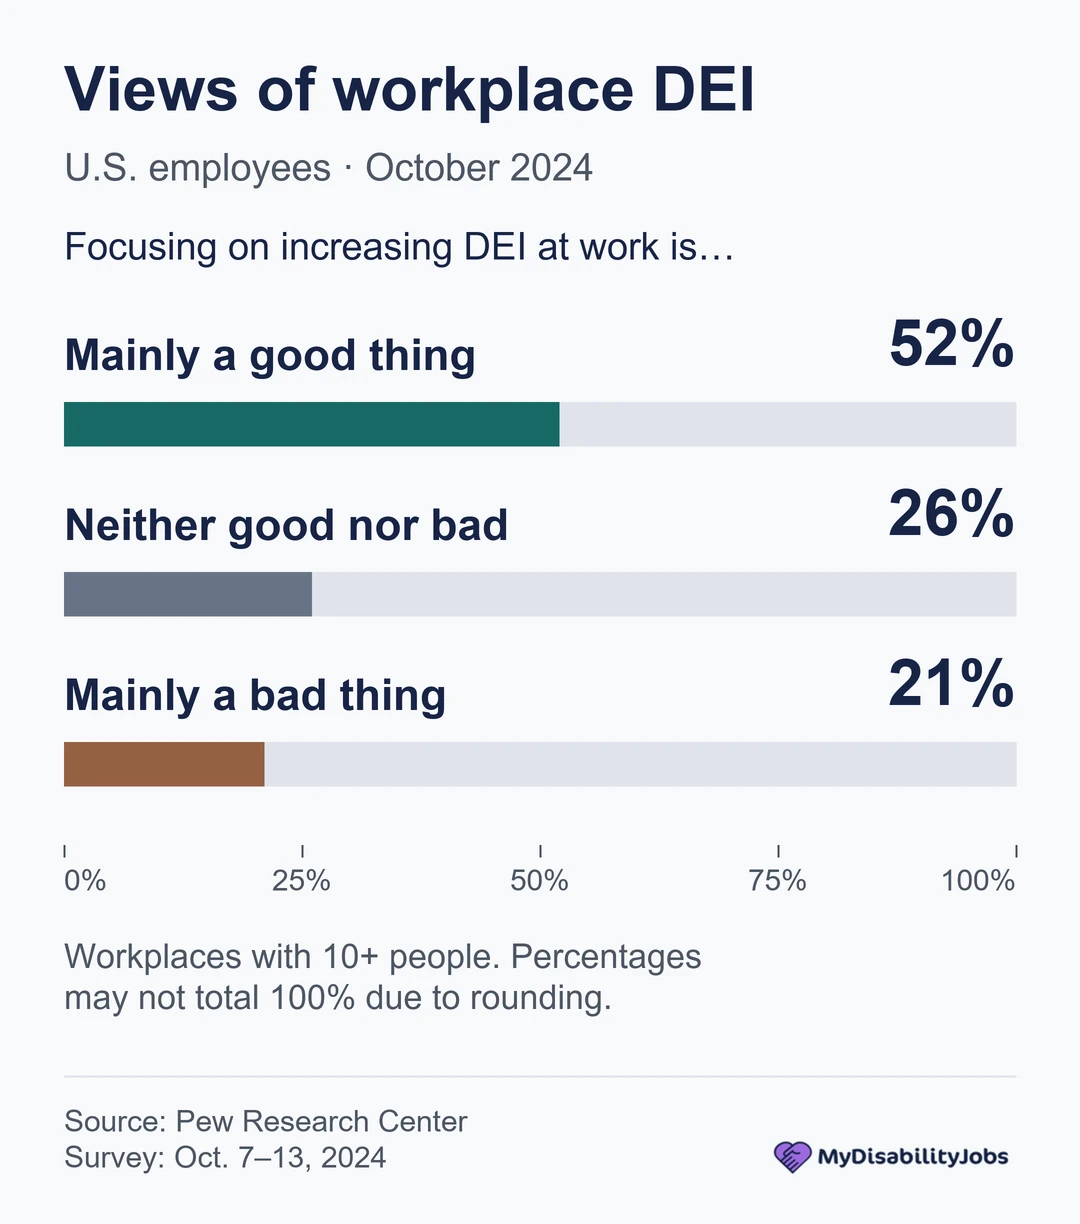
- In October 2024, 52% of U.S. employees at workplaces with at least 10 people said focusing on DEI at work was mainly a good thing.
- In a 2024 survey across 55 economies, 83% of participating large employers reported having DEI initiatives in place.
- In a May 2026 survey, 72% of U.S. adults age 18 and older considered promoting diversity, equity and inclusion a somewhat or extremely important priority for businesses.
- Women held 41.8% of U.S. management jobs and 33.0% of chief executive jobs in 2025, using an annual average that excludes October.
- Black workers held 8.8% of U.S. management jobs but accounted for 12.7% of all employed people age 16 and older in 2025, excluding October.
- Among U.S. full-time, year-round workers, women’s median annual earnings were 83.9% of men’s in 2025.
- In a July 2023 U.S. survey, 17% of LGBTQ+ workers reported workplace discrimination or harassment related to their sexual orientation or gender identity in the previous year.
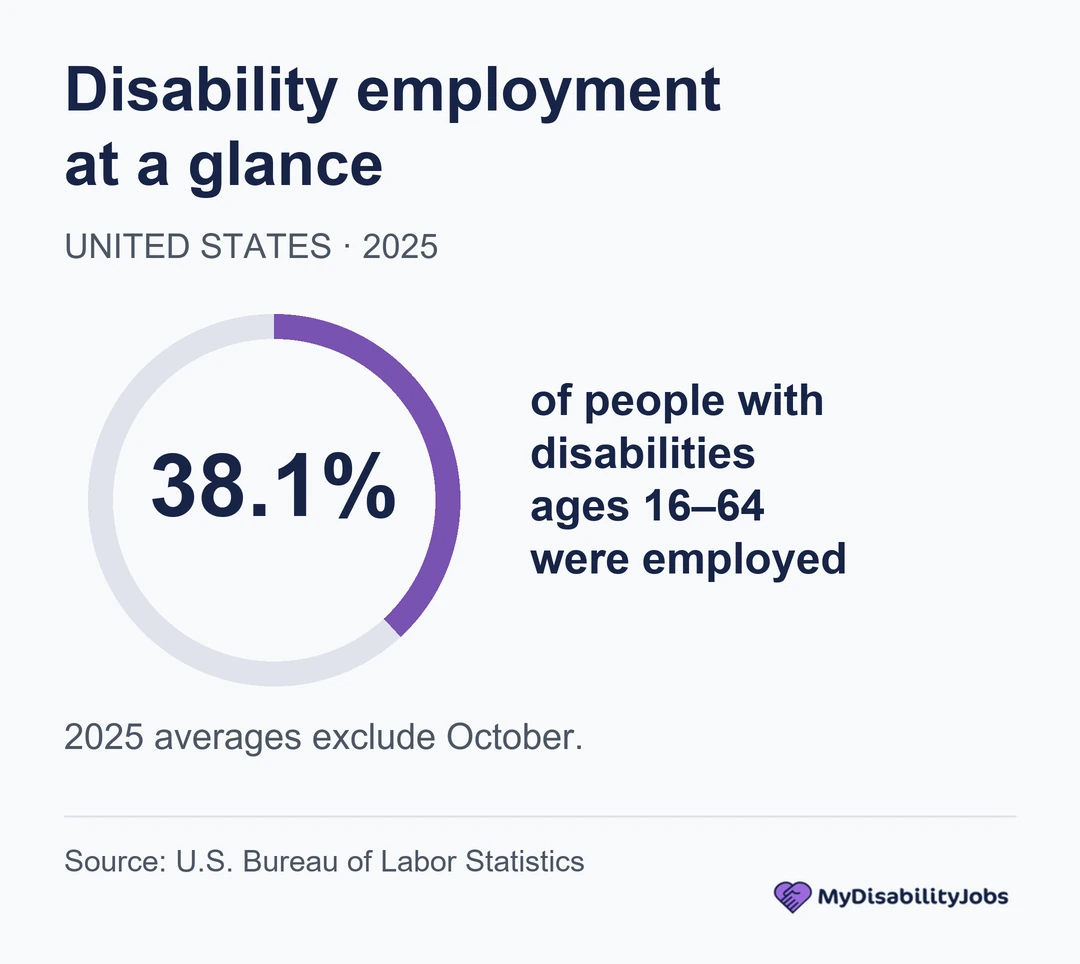
- Among U.S. people ages 16–64, 38.1% of those with a disability were employed in 2025, compared with 74.8% of those without a disability; October is excluded from these averages.
- Among Job Accommodation Network employer respondents who reported implemented accommodation costs following contacts made in 2019–2024, 61% said the accommodation cost nothing.
The management figures cover occupations across the economy, rather than Fortune 500 CEOs alone. The accommodation finding concerns selected Job Accommodation Network (JAN) service users, rather than all employers.
Sources: Pew Research Center: workplace DEI views (2024), World Economic Forum: Future of Jobs Report 2025, BLS: 2025 employment by occupation and demographics, U.S. Census Bureau: Income in the United States, 2025, Williams Institute: LGBTQ workplace experiences, July 2023 survey (2024 report), BLS: 2025 disability labor-force characteristics, Job Accommodation Network: accommodation costs, 2019–2024 contact cohort.
DEI Statistics in the Workplace
Employee views, employer-reported initiatives and hiring strategies measure different aspects of DEI. Their percentages should be read within their own survey populations.
Employee Attitudes Toward DEI
- In October 2024, 52% of U.S. employees at workplaces with at least 10 people viewed a focus on workplace DEI as mainly a good thing, compared with 56% in February 2023—a decrease of four percentage points.
- In October 2024, 19% of U.S. employees at workplaces with at least 10 people said their employer paid too much attention to DEI, compared with 12% who said too little.
- Historical finding: In a 2014 Glassdoor survey, 57% of employed respondents in its job-seeker community said their employer should do more to increase workforce diversity.
The historical Glassdoor result is not a current U.S. employee estimate; the recovered release does not specify its geographic scope or employee subgroup size. The newer employee survey excludes self-employed people and workplaces with fewer than 10 people.
For practical steps on employee participation and feedback, see our guide to fostering inclusion at work.
DEI Programs and Recruiting
- In the 2024 global employer survey used for the Future of Jobs Report 2025, 83% of participating large employers across 55 economies reported DEI initiatives in place.
- In a 2024 global survey across 55 economies, 47% of participating large employers identified tapping diverse talent pools as a promising way to increase talent availability.
These responses describe selected large employers and their reported initiatives or strategies. They do not establish a national adoption rate for all U.S. businesses or show how many diverse candidates were hired.
Employers reviewing their approach can explore fostering diversity in the workplace and practical diversity recruiting strategies.
Public Attitudes Toward Business DEI
- In a May 2026 survey, 72% of U.S. adults age 18 and older considered promoting diversity, equity and inclusion a somewhat or extremely important priority for businesses.
- In a May 2026 survey, 34% of U.S. adults age 18 and older rated businesses’ efforts to promote DEI as good or excellent.
- In December 2025, 64% of U.S. adults said it was very or somewhat important for companies and organizations to promote racial and ethnic diversity in their workplace, compared with 75% in 2019.
The May 4–11, 2026 survey used a weighted, probability-based panel of 3,270 U.S. adults. These results describe public perceptions, not measured DEI program effectiveness. The December 2025 finding also concerns U.S. adults and is separate from the employee survey above.
Sources: Pew Research Center: workplace DEI views (2024), Glassdoor 2014 diversity survey, World Economic Forum: Future of Jobs Report 2025, Bentley University–Gallup: public views of business DEI (2026), Pew Research Center: racial and ethnic diversity views, December 2025 survey (2026).
U.S. Workforce Diversity Statistics
These national workforce diversity statistics describe employed civilian, noninstitutionalized people age 16 and older. The 2025 averages exclude October because data were not collected during the federal government shutdown; they are not strictly comparable with standard annual averages.
- Women represented 47.1% of employed U.S. people age 16 and older in 2025, excluding October.
- Black or African American workers represented 12.7% of employed U.S. people age 16 and older in 2025, excluding October.
- Asian workers represented 7.5% of employed U.S. people age 16 and older in 2025, excluding October.
- Hispanic or Latino workers represented 20.0% of employed U.S. people age 16 and older in 2025, excluding October.
Hispanic or Latino is an ethnicity and can overlap with any race. These categories should not be added as if they were mutually exclusive. Employment also differs from the labor force, which includes unemployed people who are seeking and available for work.
Sources: BLS: 2025 employment by occupation and demographics.
Gender Diversity in the Workplace Statistics
Women in Management and Leadership
- In 2025, women held 41.8% of U.S. management jobs and 33.0% of chief executive jobs; both figures use annual averages excluding October.
- Women held 29% of C-suite positions in participating U.S. and Canadian companies at the start of 2025.
- During 2024, women in participating U.S. and Canadian companies were promoted to manager at a rate equivalent to 93 women for every 100 men, after normalizing for the eligible workforce.
- In a July–August 2025 survey of U.S. and Canadian corporate employees, 50% of women reported having a sponsor at work, compared with 56% of men.
The national occupational estimates and the corporate surveys use different populations. Chief executive occupations extend beyond major-company CEOs; the corporate C-suite figure comes from a voluntary company sample. The promotion comparison uses gender-specific rates, rather than a raw count of promotions. A sponsor actively advocates for an employee’s advancement.
For a narrower industry perspective, see our technology industry diversity statistics.
Gender Pay Statistics
- Among U.S. full-time, year-round workers, women’s median annual earnings were 83.9% of men’s in 2025.
This is an unadjusted comparison of annual median earnings, rather than a comparison of pay for identical jobs. It does not control for occupation, experience or other differences between workers.
Sources: BLS: 2025 employment by occupation and demographics, McKinsey / LeanIn.Org: Women in the Workplace 2025, updated February 2026, U.S. Census Bureau: Income in the United States, 2025.
Racial and Ethnic Diversity in the Workplace Statistics
- In 2025, Black workers held 8.8% of U.S. management jobs while accounting for 12.7% of all employed people age 16 and older; these averages exclude October.
- In 2025, Hispanic or Latino workers held 13.5% of U.S. management jobs while accounting for 20.0% of all employed people age 16 and older; these averages exclude October.
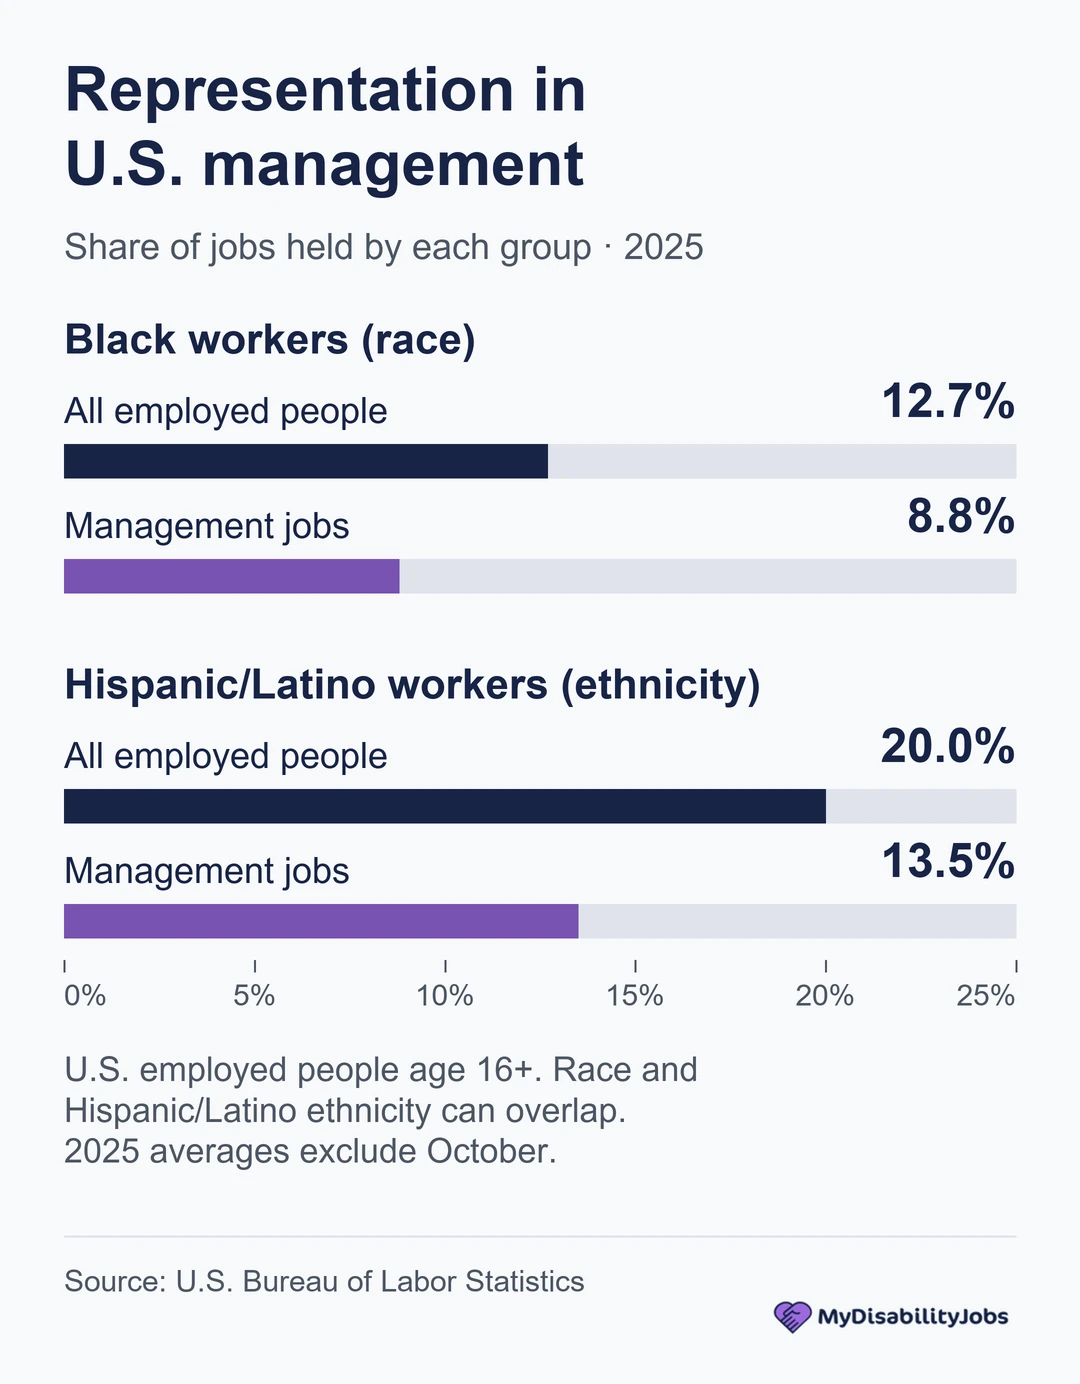
Both comparisons use the same national employment dataset. Hispanic or Latino ethnicity can overlap with race. These representation gaps describe workforce composition; they do not measure an individual’s chance of promotion or establish the cause of the differences.
For a broader look at reported unequal treatment, explore our workplace and employment discrimination statistics.
Sources: BLS: 2025 employment by occupation and demographics.
LGBTQ+ Workplace Diversity Statistics
The findings below come from a U.S. survey of 1,902 LGBTQ+ adults age 18 and older in the workforce, conducted in July 2023 and published in August 2024. The survey measured experiences respondents attributed to their sexual orientation or gender identity. Lifetime experiences, experiences in the previous year and disclosure at a current job are separate measures.
Workplace Discrimination and Harassment
- In the July 2023 U.S. survey, 47.1% of LGBTQ+ workers reported workplace discrimination or harassment related to their sexual orientation or gender identity at some point in their lives.
- In the July 2023 U.S. survey, 17% of LGBTQ+ workers reported workplace discrimination or harassment related to their sexual orientation or gender identity in the previous year.
- In the July 2023 U.S. survey, 15% of LGBTQ+ workers of color reported sexual-orientation- or gender-identity-related workplace discrimination in the previous year, compared with 7% of White LGBTQ+ workers.
- In the July 2023 U.S. survey, 22% of transgender and nonbinary workers reported sexual-orientation- or gender-identity-related workplace discrimination in the previous year, compared with 9% of cisgender LGBQ workers.
- In the July 2023 U.S. survey, 36% of LGBTQ+ workers said they had heard negative comments, slurs or jokes about LGBTQ+ people at work in the previous year.
Discrimination measures include being fired, not hired or not promoted. Hearing negative comments is a workplace-climate measure and does not necessarily mean the respondent was personally targeted.
Disclosure and Employee Retention
- In the July 2023 U.S. survey, 46% of LGBTQ+ workers said they were not out to their current supervisor.
- In the July 2023 U.S. survey, 33.5% of LGBTQ+ workers said they had left a job because of treatment related to their sexual orientation or gender identity at some point in their lives.
The departure figure is a lifetime experience, rather than an annual turnover rate. Disclosure responses do not establish that being out causes discrimination or that concealment prevents it.
Sources: Williams Institute: LGBTQ workplace experiences, July 2023 survey (2024 report).
Disability Inclusion and Employment Statistics
Employment and Unemployment
The national disability estimates below cover the civilian, noninstitutionalized population. Their 2025 averages exclude October because of the federal government shutdown and are not strictly comparable with standard annual averages.
- In 2025, 22.8% of U.S. people age 16 and older with a disability were employed, compared with 65.2% of those without a disability; October is excluded from these averages.
- Among U.S. people ages 16–64, 38.1% of those with a disability were employed in 2025, compared with 74.8% of those without a disability; October is excluded from these averages.
- In 2025, the U.S. unemployment rate among people age 16 and older in the labor force was 8.3% for those with a disability and 4.1% for those without a disability, excluding October.
- In 2025, about 30% of employed U.S. people age 16 and older with a disability usually worked part time, compared with about 17% of those without a disability; October is excluded from these averages.
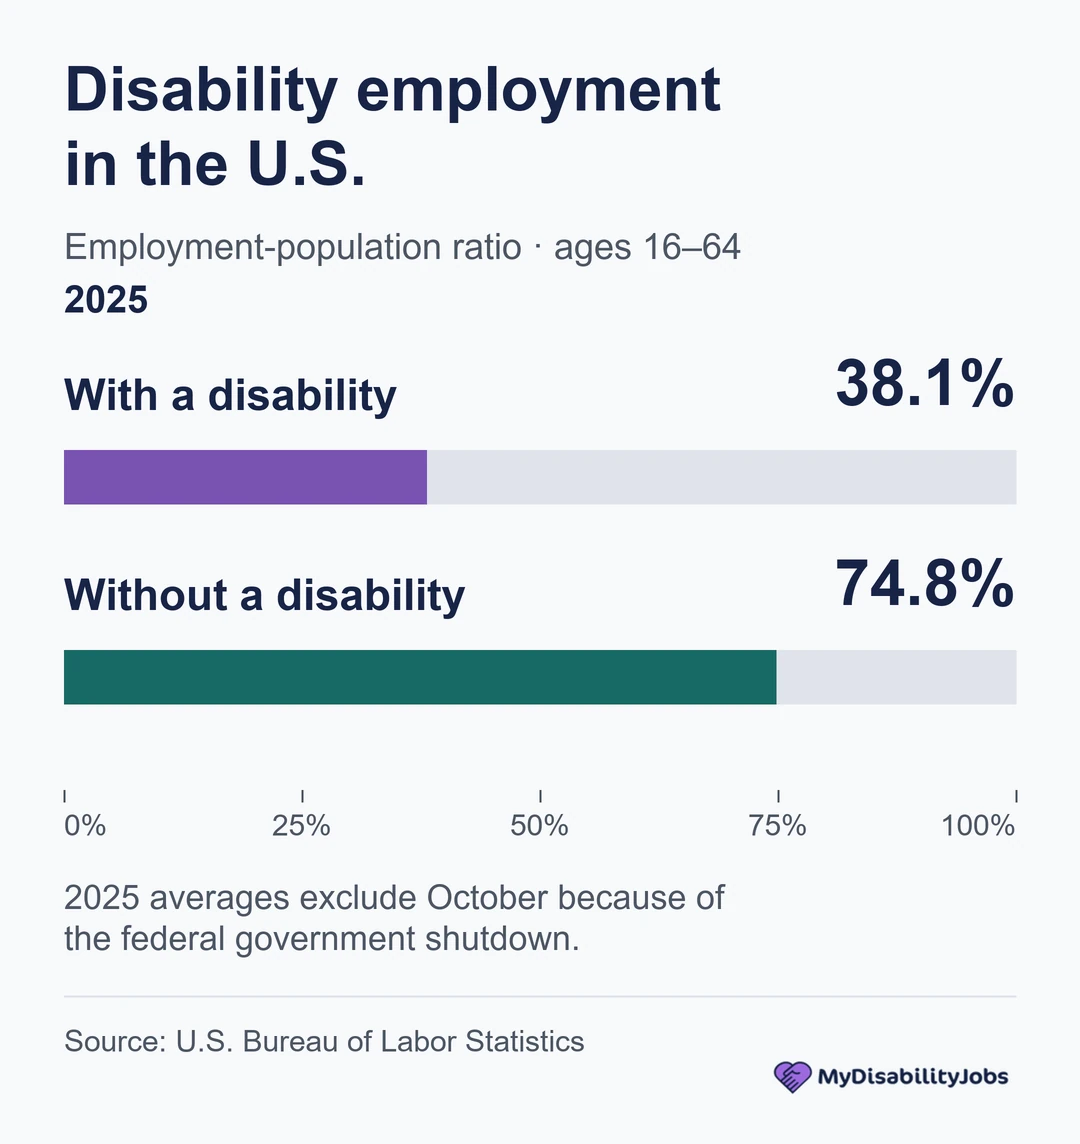
Employment-population ratios count employed people as a share of the population group; unemployment rates use the labor force as their denominator. The all-age employment gap partly reflects the older age profile of people with disabilities. Usually working part time does not necessarily mean involuntary part-time work or a workplace accommodation.
For employer actions beyond these employment figures, see our guide to workplace accessibility.
Workplace Adjustments
- In July 2024, 31.8% of employed U.S. people ages 16–75 with a work-limiting health condition or difficulty had ever requested or made a change to help them do their current job better, compared with 3.4% of employed people without such a condition or difficulty.
- Among employed U.S. people ages 16–75 with a work-limiting health condition or difficulty who had requested or made a change to their current job, 47.8% reported schedule changes, 36.0% changes to work tasks and 17.8% telework in the July 2024 survey.
Work-limiting health conditions or difficulties differ from the standard BLS disability category. Employees reported requests, while self-employed workers reported changes they made. Multiple changes were possible; these figures do not show that requests were granted or classified as formal ADA accommodations.
Workplace Accommodation Costs
- Among Job Accommodation Network employer respondents who reported implemented accommodation costs following contacts made in 2019–2024, 61% said the accommodation cost nothing.
- Among Job Accommodation Network employer respondents reporting a one-time accommodation cost following contacts made in 2019–2024, the median cost was $300.
These findings concern selected users of a U.S.-based accommodation service, not a representative sample of all U.S. employers. The one-time median excludes no-cost and ongoing-only cases. The pooled contact period should not be interpreted as costs incurred solely in the report’s 2025 update year.
For examples that connect individual workplace barriers with possible adjustments, see workplace accommodations for autism.
Career Mobility for Workers With Disabilities
- In a 2023–2024 analysis of employed U.S. LinkedIn members who voluntarily identified as having a disability, 9.3% moved into higher-seniority jobs over one year: 7.3% by changing employers and 2.0% within the same company.
These self-selected LinkedIn profile data are not representative of the U.S. workforce. Higher seniority is inferred from job histories and does not necessarily mean a formal internal promotion. The analysis does not establish that disclosing a disability causes career outcomes.
Sources: BLS: 2025 disability labor-force characteristics, Job Accommodation Network: accommodation costs, 2019–2024 contact cohort, BLS: July 2024 Disability Supplement, work-limiting health conditions and job changes (2025 release), LinkedIn / Disability:IN: disability and career mobility (December 2025).
Employer DEI Policies and Corporate Reporting
Changes in DEI Reporting
- In a 2025 analysis of U.S. S&P 100 companies, 53% adjusted how they communicated or organized DEI efforts in annual-report filings compared with 2024.
- In a 2025 analysis of U.S. S&P 100 companies, 21% reduced or removed DEI-related metrics and targets from disclosures compared with 2024.
- The 2026 Corporate Equality Index reported 131 Fortune 500 current-cycle survey submissions, down from 377 in its comparison with the 2025 cycle.
The filings analysis used disclosures available through July 14, 2025. The CEI comparison uses the 2026 report’s own counts; the earlier 2025 edition listed 376 Fortune 500 participants. Changes in public disclosure or survey participation do not establish that employers eliminated DEI programs or repealed inclusive policies.
For practical implementation beyond reporting, see our guide to managing diversity in the workplace.
Employer Nondiscrimination Policies
- The 2025 Corporate Equality Index reported that 95% of U.S. Fortune 500 companies included both sexual orientation and gender identity in their nondiscrimination policies.
- The 2025 Corporate Equality Index reported transgender-inclusive health benefits at 72% of U.S. Fortune 500 companies.
These are policy snapshots from the 2025 report edition, rather than verified-current coverage for every company in 2026. Policy presence also does not establish how employees experience those protections or benefits.
Sources: The Conference Board / ESGAUGE: DEI disclosures (2025), HRC Foundation: Corporate Equality Index 2026, HRC Foundation: Corporate Equality Index 2025.
Benefits of Workplace Diversity — Key Statistics
For a fuller discussion of the benefits of diversity and inclusion in the workplace, explore our separate guide. The finding below provides a brief example of research on organizational outcomes.
- A 2023 observational analysis of U.S. Disability Equality Index participants found that disability-inclusion leaders had 1.6 times the revenue, 2.6 times the net income and twice the economic profit of other participants over the study’s five-year financial comparison period.
The analysis drew on company responses collected during 2015–2022. These associations do not prove that disability inclusion caused the financial differences or guarantee a return on investment. Economic profit is also a different measure from profit margin.
Sources: Accenture / Disability:IN / AAPD: disability inclusion outcomes (2023).
Is your company offering jobs for people with disabilities? As an employer, you can publish your job offers on MyDisabilityJobs and reach thousands of qualified candidates.
About the Data and Research Methods
MyDisabilityJobs curates third-party diversity and inclusion data. The Sources footers link to the original reports and datasets; dates in the findings identify the measurement period or report edition.
National household-survey estimates, selected company samples and employee opinion surveys answer different questions. The LGBTQ+ survey used weighted online nonprobability panels, and the global employer survey focused on large organizations. Their findings should not be treated as interchangeable national workforce measures.
Changes between compatible percentages are described in percentage points. Annual earnings ratios are unadjusted, and company financial comparisons are observational. Differences across studies with changing populations or definitions should not be combined into a single trend.
Conclusion
Workplace diversity statistics show differences in representation, career progression and employee experiences. Using them well means keeping the population, data period and measured outcome attached to each finding, whether the subject is an employment gap, a survey response or an employer policy.
Related MDJ resources
- Inclusive workplace practices — practical approaches to participation and workplace inclusion.
- Neurodiversity in the workplace statistics — a more focused look at neurodivergent workers and employment evidence.
- Workplace bullying statistics — related research on bullying and workplace experiences.
leave your comment