

Intellectual Disability Employment Statistics 2026: Jobs, Wages & Outcomes
Intellectual disability employment statistics can vary substantially depending on the population and employment measure being studied. Some datasets measure people with intellectual disability specifically, while others cover the broader population of people with intellectual and developmental disabilities (IDD) or use categories such as cognitive disability.
This statistics roundup focuses on the strongest available employment data for people with intellectual disabilities and IDD, including paid community employment, competitive integrated employment, vocational rehabilitation outcomes, postsecondary education, employment settings, and historical labor-force data.
An important distinction applies throughout the article: an employment rate, an unemployment rate, a paid community job rate, and a Vocational Rehabilitation employment outcome are not interchangeable measures. Each statistic below therefore identifies the population or program being measured rather than presenting one number as a universal U.S. intellectual disability employment rate.
In this intellectual disability employment statistic roundup, you’ll learn:
–Intellectual Disability Employment Statistics: Editor’s Picks
–How to Read Intellectual Disability Employment Statistics
–Employment and Competitive Integrated Employment
–Are 80% of Adults With Intellectual Disabilities Unemployed?
–Education and Employment Outcomes
–Vocational Rehabilitation Outcomes
–Wages and Changing Employment Settings
–Employment Barriers and Supports
Is your company offering suitable jobs for people with disabilities? As an employer, you can publish your job offers on MyDisabilityJobs and reach thousands of qualified candidates.
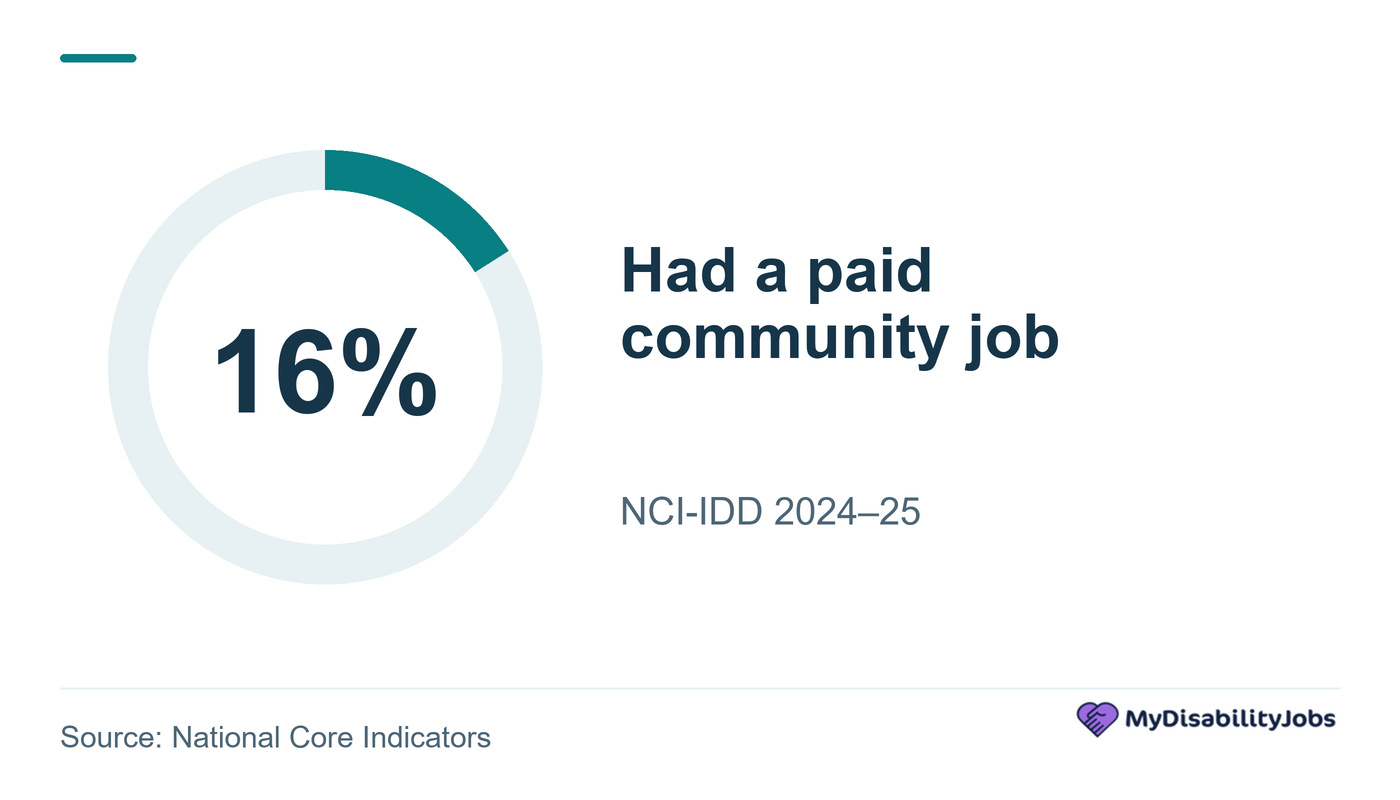
- Paid Community Employment: Only 16% of people surveyed in the latest NCI-IDD data had a paid community job.
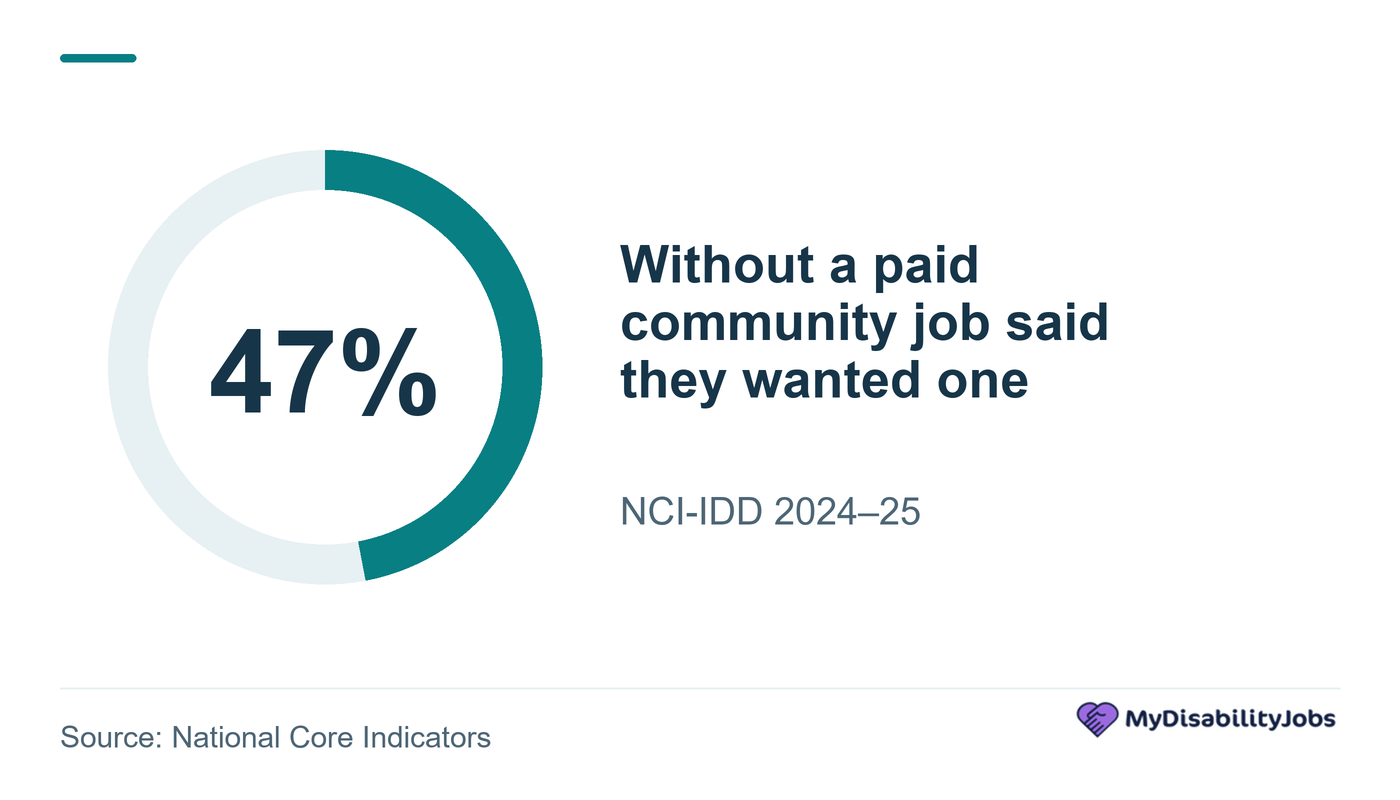
- Desire to Work: Among respondents who did not have a paid community job, 47% said they wanted one.
- Competitive Integrated Employment: In 2024, 16% of people receiving services from state intellectual and developmental disabilities agencies worked in individual competitive integrated jobs.
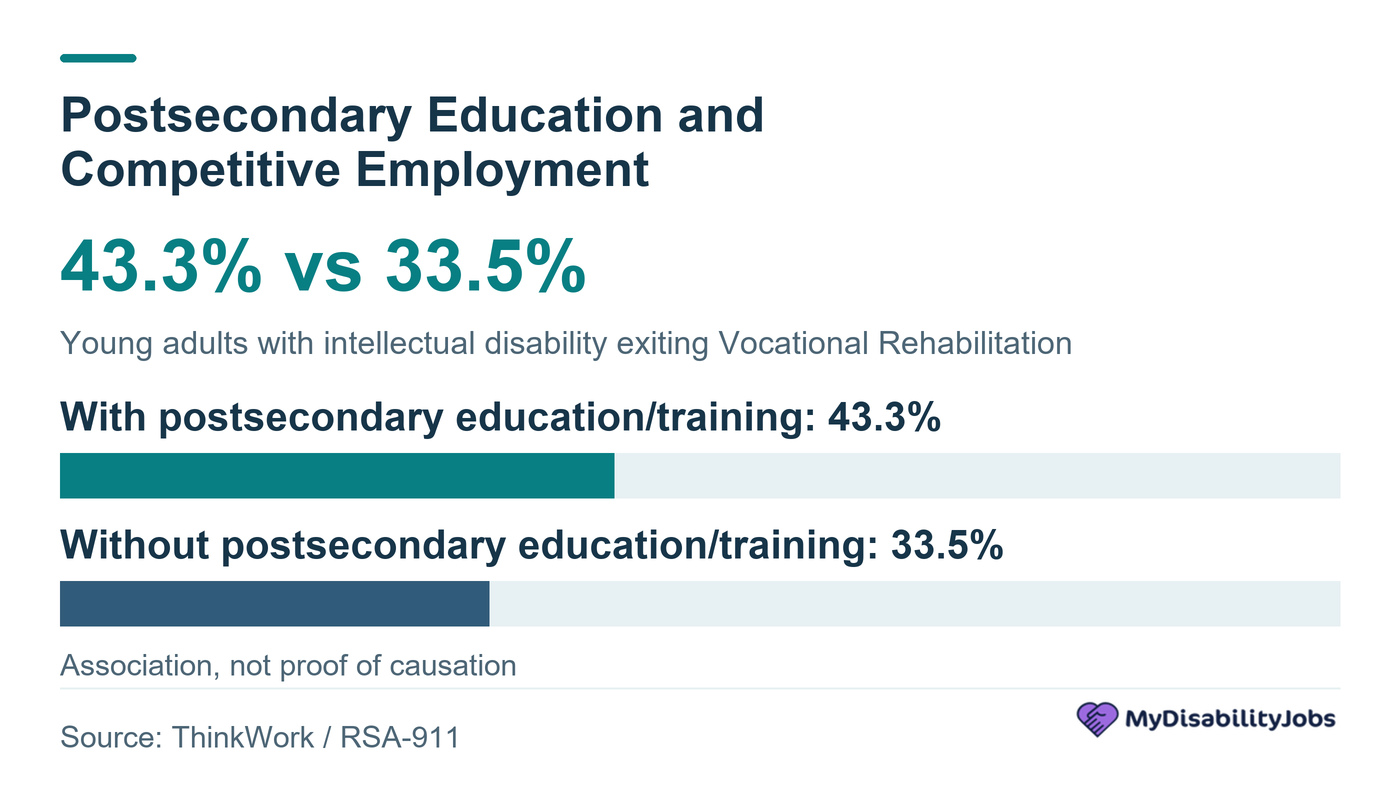
- Postsecondary Education and Employment: Among young adults with intellectual disability receiving Vocational Rehabilitation services, 43.3% of those who received postsecondary education or career training exited in competitive integrated employment, compared with 33.5% of those who did not receive those services.
- Access to Postsecondary Training: Only 9.4% of the study population received postsecondary education or career-training services.
- Sheltered Workshops: Participation in sheltered workshops funded by state IDD agencies fell 55% between 2015 and 2023, reaching 45,926 people in 2023.
- Vocational Rehabilitation: The rehabilitation rate for adults with intellectual disability using Vocational Rehabilitation services was 37% in 2025, compared with approximately 55% in 2016.
- State Differences: In 2025, Vocational Rehabilitation rehabilitation rates for people with intellectual disability ranged from approximately 58% in Georgia to 16% in West Virginia.
- Historical Labor-Force Data: A major U.S. survey of working-age adults with intellectual disability found that 34% were employed, 21% were unemployed, 44% participated in the labor force, and 28% had never held a job.
Sources: National Core Indicators — NCI-IDD 2024–25 In-Person Survey; ThinkWork / StateData — Employment Data for People with Intellectual and Developmental Disabilities; ThinkWork — The Pathway From Education to Employment: From College to Career Project; ThinkWork — Vocational Rehabilitation Services and Outcomes of People with Intellectual Disabilities: 2016–2025; Special Olympics — National Snapshot of Adults with Intellectual Disabilities in the Labor Force.
How to Read Intellectual Disability Employment Statistics
Employment data for people with intellectual disabilities come from several different types of datasets, and the populations they measure should not be treated as interchangeable.
- Intellectual disability (ID) refers specifically to limitations in intellectual functioning and adaptive behavior that begin during the developmental period.
- Intellectual and developmental disabilities (IDD) is a broader category that can include intellectual disability as well as other developmental disabilities.
- Cognitive disability is a broader survey category used in datasets such as the American Community Survey and should not be treated as equivalent to intellectual disability.
- Paid community employment measures whether a person has a paid job in the community within a particular service-system population.
- Competitive integrated employment (CIE) generally refers to work in the community alongside people without disabilities, for competitive wages and under comparable employment conditions.
- Vocational Rehabilitation outcomes describe people participating in a specific employment-services program and are not population-wide employment rates.
These distinctions are particularly important when interpreting older statistics. A person who is not employed is not necessarily statistically unemployed, and a percentage measured among people receiving disability services should not automatically be generalized to every adult with intellectual disability in the United States.
Throughout this article, statistics are therefore labeled according to the population, service system, year, and employment measure used by the original source.
Employment and Competitive Integrated Employment
Recent U.S. employment data for people with intellectual and developmental disabilities are strongest when they are tied to a clearly defined service-system population. These figures should not be interpreted as a single national employment rate for every adult with intellectual disability.
The latest National Core Indicators data show a substantial gap between the number of people with IDD who have paid community employment and the number who say they want to work.
- Paid Community Jobs: 16% of respondents in the 2024–25 NCI-IDD data had a paid community job.
- Want to Work: Among respondents who did not have a paid community job, 47% said they wanted one.
ThinkWork’s StateData project provides a related measure focused on competitive integrated employment among people receiving services from state intellectual and developmental disabilities agencies.
- Competitive Integrated Employment: In 2024, 16% of people receiving state IDD agency services worked in individual competitive integrated jobs.
- Average Weekly Hours: People working in individual competitive integrated jobs worked an average of 28.07 hours per week.
- Average Hourly Wage: Average hourly earnings in those jobs were $14.38.
These measures describe people participating in state IDD service systems. They should not be generalized to every adult with intellectual disability in the United States.
A paid community job and competitive integrated employment are also related but not identical measures. Competitive integrated employment generally refers to an individual community job in which the worker earns a regular wage and works alongside coworkers who do not have disabilities.
Sources: National Core Indicators — NCI-IDD 2024–25 In-Person Survey; ThinkWork / StateData — Employment Data for People with Intellectual and Developmental Disabilities.
Are 80% of Adults With Intellectual Disabilities Unemployed?
Claims that roughly 80% of adults with intellectual disabilities are unemployed are widely repeated, but they should not be treated as a current national U.S. unemployment rate.
One reason is that “not employed” and “unemployed” are different labor-market measures. A person without a job may be outside the labor force rather than statistically unemployed.
Historical U.S. research illustrates this distinction. A major survey commissioned by Special Olympics and conducted by the Center for Social Development and Education at the University of Massachusetts Boston, with Gallup administering the survey, reported several different measures for adults with intellectual disability aged 21–64:
- Labor-Force Participation: 44% were in the labor force.
- Employment: 34% were employed.
- Unemployment: The report stated that 21% of working-age adults with intellectual disability were unemployed.
- Never Worked: 28% had never held a job.
The figures describe different concepts and should not be collapsed into a single “around 80% unemployed” statistic.
What About the 19.1% Employment Statistic?
An earlier version of this MyDisabilityJobs article stated that only 19.1% of people with intellectual disabilities were employed in the United States.
That figure should not be presented as a national intellectual-disability employment rate.
The 19.1% figure appears in 2018 U.S. Bureau of Labor Statistics data as the employment-population ratio for people with disabilities overall, rather than for people with intellectual disability specifically.
The old 19.1% statistic is therefore useful as historical context for disability employment generally, but it should not be attributed specifically to adults with intellectual disability.
What About the 17% Unemployment Statistic?
The previous version of this article also reported a 17% unemployment rate for adults with intellectual disability.
MyDisabilityJobs has not identified an original population-level source that supports 17% as a national U.S. unemployment rate for all adults with intellectual disability.
The traceable historical Special Olympics labor-force survey reported 21% unemployment in its study population, not 17%.
For this reason, the 17% figure should not be presented as the current or historical national unemployment rate for adults with intellectual disability unless a source with a clearly defined population and methodology can be identified.
The most defensible approach is to report intellectual-disability employment statistics according to the population and measure used by the original dataset rather than converting low employment rates into unemployment rates.
Sources: Special Olympics — National Snapshot of Adults with Intellectual Disabilities in the Labor Force; U.S. Bureau of Labor Statistics — Persons with a Disability: Labor Force Characteristics, 2018.
Education and Employment Outcomes
Recent national Vocational Rehabilitation data provide evidence that postsecondary education and career training are associated with stronger employment outcomes for young adults with intellectual disability.
A 2026 ThinkWork analysis used national RSA-911 data covering people aged 17–35 whose primary disability was intellectual disability and who exited Vocational Rehabilitation between 2020 and 2023.
The analytic sample included more than 100,000 young adults.
- Postsecondary Education Participation: Only 9.4% of the study population received postsecondary education or career/technical training through Vocational Rehabilitation.
- Competitive Integrated Employment: 43.3% of participants who received postsecondary education or training exited VR in competitive integrated employment, compared with 33.5% of those who did not receive those services.
- Weekly Hours: Participants who received postsecondary education or training worked an average of 27.7 hours per week at exit, compared with 21.9 hours among those who did not.
- Hourly Wages: Average hourly wages at exit were $13.63 among participants who received postsecondary education or training, compared with $12.27 among those who did not.
The differences in competitive integrated employment, hours worked, and hourly wages were statistically significant.
The analysis also found that the association between postsecondary education and competitive integrated employment remained significant after researchers accounted for demographic characteristics and several barriers to employment.
These findings describe young adults with intellectual disability participating in the Vocational Rehabilitation system. They should not be interpreted as employment rates for all young adults with intellectual disability.
Vocational Rehabilitation Outcomes
Vocational Rehabilitation data provide one of the strongest national administrative datasets focused specifically on people with intellectual disability, but VR outcomes should not be treated as population-wide employment rates.
The latest ThinkWork analysis covers adults with intellectual disability who exited state Vocational Rehabilitation programs in all 50 states and the District of Columbia between 2016 and 2025.
In 2025, 36,262 people with intellectual disability exited the VR program.
- Rehabilitation Rate: Among people with intellectual disability who received VR services, 37% exited with an employment outcome in 2025.
- Long-Term Trend: The rehabilitation rate declined from 55% in 2016 to 37% in 2025.
- Employment Within One Year: 22% of people with intellectual disability exited VR with employment within one year of application in 2025, compared with 42% of people with other disabilities.
- State Differences: Rehabilitation rates for people with intellectual disability varied substantially by state, from 58% in Georgia to 16% in West Virginia in 2025.
- State Wage Differences: Among people with intellectual disability exiting VR with employment, average hourly wages ranged from $18.17 in California to $11.35 in Wyoming.
The rehabilitation rate measures the percentage of people who received VR services and then exited the program with an employment outcome. It is not the same as the employment rate of the broader population with intellectual disability.
State comparisons should also be interpreted cautiously because state VR systems differ in service delivery, eligibility, caseload composition, local labor markets, and administrative practices.
Wages and Changing Employment Settings
Recent administrative data show that employment outcomes for people with intellectual disability involve not only whether someone has a job, but also the hours they work, the wages they earn, and the type of employment setting in which they receive services.
Wages and Hours
Among people with intellectual disability who exited Vocational Rehabilitation with employment in 2025:
- Average Hourly Wage: $14.24 per hour, compared with $20.29 among people with other disabilities.
- Average Weekly Hours: 22 hours per week, compared with 32 hours among people with other disabilities.
A broader ThinkWork comparison of inflation-adjusted weekly wages found a particularly large earnings gap in 2024:
- Intellectual Disability: Average weekly wages were $311.
- Other Disabilities: Average weekly wages were $654.
- No Disability: Average weekly wages were $1,337.
In that comparison, people without disabilities earned more than four times the average weekly wages of workers with intellectual disability.
The comparison combines VR wage data for people with intellectual disability and other disabilities with American Community Survey data for the general population without disabilities. It should therefore be read as a contextual comparison rather than a perfectly like-for-like wage-gap measure.
Sheltered and Integrated Employment
Employment settings have also changed substantially over time.
- Sheltered Workshops: The number of people participating in sheltered workshops funded through state IDD agencies fell by 55% between 2015 and 2023.
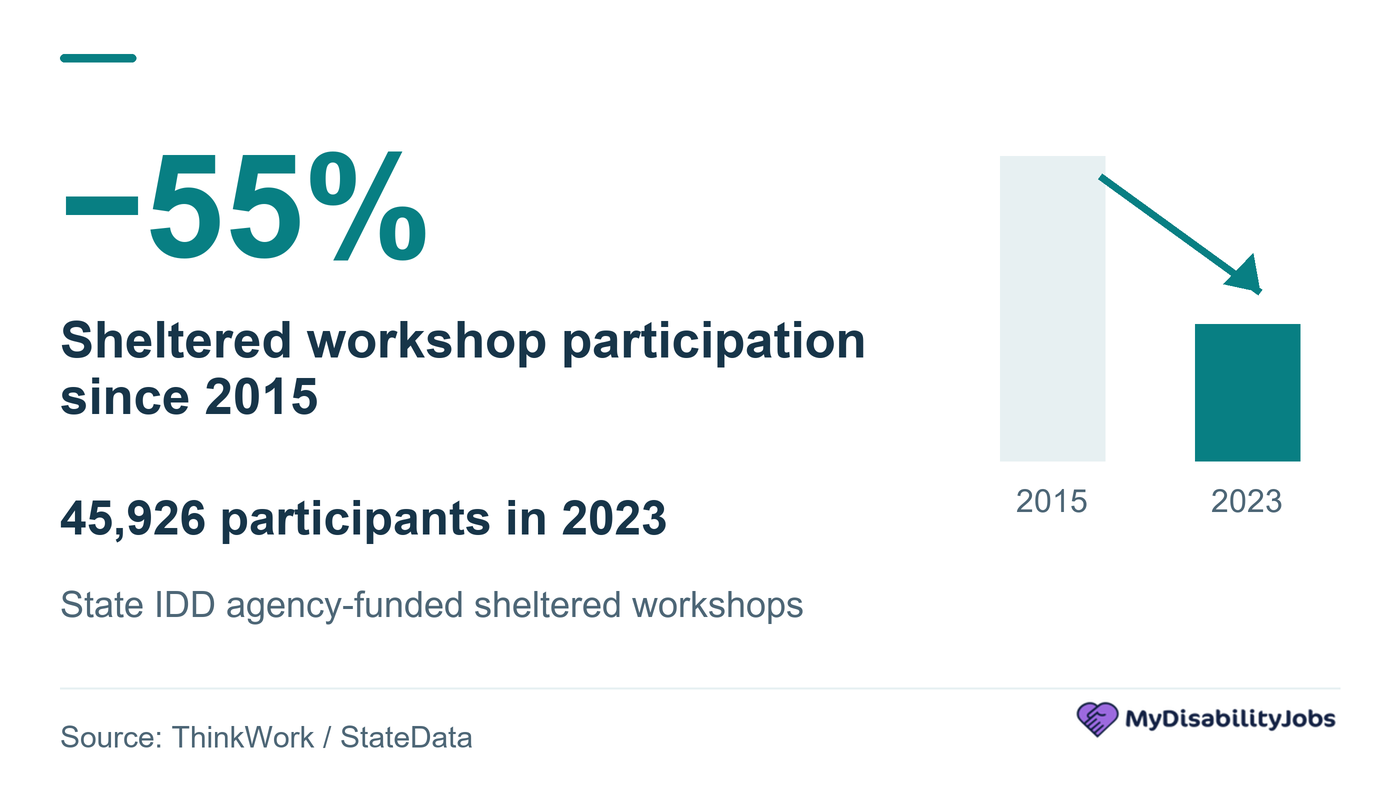
- Sheltered Workshop Participation: 45,926 people participated in sheltered workshops in 2023.
- Integrated Employment Services: By 2023, more than 130,000 people participated in services designed to lead to or maintain integrated employment, up from only a few thousand in 1988.
These figures describe participation in employment and day services funded through state intellectual and developmental disability agencies. They should not be interpreted as counts of every person with intellectual disability working in the United States.
Sources: ThinkWork / Institute for Community Inclusion — Vocational Rehabilitation Services and Outcomes of People with Intellectual Disabilities: 2016–2025; ThinkWork / StateData — Employment and Day Services Trends.
Employment Barriers and Supports
Employment outcomes for people with intellectual and developmental disabilities are influenced by more than whether jobs are available. National Core Indicators data show strong associations between employment and practical supports such as transportation and employment goals in individualized service plans.
These findings describe adults with IDD receiving state-funded developmental-disability services. They should not be interpreted as population-wide employment rates or as proof that any single support directly causes employment.
Transportation and Paid Employment
In the 2022–23 NCI-IDD survey:
- Young Adults: 15% of respondents aged 18–22 had a paid community job.
- Transportation Access: Among 18–22-year-olds with access to transportation, 26% had a paid community job.
- Ages 23–34: Among people aged 23–34 with access to transportation, 34% had a paid community job.
NCI identifies transportation as an important practical factor affecting access to employment and broader community participation.
The figures show an association between transportation access and paid employment within the survey population. They do not establish that transportation access alone causes the difference in employment outcomes.
Employment Goals in Service Plans
Employment planning was also associated with higher rates of paid community employment.
In the same 2022–23 NCI-IDD data:
- Employment Planning: 25% of all respondents had an employment goal in their service plan.
- Ages 23–34: Among people in this age group who had an employment goal in their service plan, 44% had a paid community job.
- Ages 35–54: Among people aged 35–54 with an employment goal in their service plan, 46% had a paid community job.
For comparison, 19% of all NCI-IDD respondents aged 35–54 had a paid community job, making the 46% rate among those with an employment goal more than twice as high within that age group.
These results do not prove that adding an employment goal to a service plan directly produces employment. They show a strong relationship between employment-focused planning and employment outcomes in the NCI-IDD service-system population.
Source: National Core Indicators — Employment and Education Data Spotlight, 2022–23 NCI-IDD In-Person Survey.
Is your company offering jobs for people with disabilities? As an employer, you can publish your job offers on MyDisabilityJobs and reach thousands of qualified candidates.
Conclusion
Current employment data for people with intellectual disabilities show why a single national employment or unemployment rate can be misleading. Recent datasets measure different populations, including people receiving state IDD services, Vocational Rehabilitation participants, and broader cognitive-disability populations.
The strongest recent evidence nevertheless points to several consistent themes. Paid community and competitive integrated employment remain relatively uncommon among people receiving IDD services, many people without paid work say they want a job, and employment outcomes vary substantially depending on access to education, transportation, employment planning, and vocational services.
The data also show meaningful changes in employment settings. Participation in state-funded sheltered workshops has fallen sharply since 2015, while competitive integrated employment remains a central goal of federal and state disability-employment policy.
Historical statistics such as the widely repeated 80% unemployment claim, the old 19.1% employment figure, and the 17% unemployment figure should not be treated as current national rates for adults with intellectual disability without clearly defining the population and source behind them.
For broader disability labor-market context, see our Disability and Employment Statistics. For another condition-specific employment dataset, see our Autism Employment Statistics 2026.
FAQ
There is no single national employment rate that accurately represents every adult with intellectual disability in the United States. In the 2024–25 NCI-IDD data, 16% of respondents had a paid community job. Separately, ThinkWork reported that 16% of people receiving state IDD agency services worked in individual competitive integrated jobs in 2024. These figures describe specific service-system populations and should not be treated as population-wide employment rates.
There is no single verified current national unemployment rate for all U.S. adults with intellectual disabilities. A historical Special Olympics labor-force survey reported 21% unemployment among adults with intellectual disability aged 21–64 in its study population. Newer datasets often measure paid community employment, competitive integrated employment, or Vocational Rehabilitation outcomes rather than a national unemployment rate.
The widely repeated claim that around 80% of adults with intellectual disabilities are unemployed should not be treated as a current national U.S. unemployment rate. “Not employed” and “unemployed” are different measures. A historical Special Olympics survey reported 34% employed, 21% unemployed, 44% in the labor force, and 28% who had never held a job in its study population.
ThinkWork reported that 16% of people receiving services from state intellectual and developmental disabilities agencies worked in individual competitive integrated jobs in 2024. This figure applies to people receiving state IDD agency services and is not a national employment rate for every person with intellectual disability.
Recent national Vocational Rehabilitation data found that 43.3% of young adults with intellectual disability who received postsecondary education or career training exited VR in competitive integrated employment, compared with 33.5% of those who did not receive those services. The study found an association between postsecondary education or training and stronger employment outcomes, but it should not be interpreted as proof that education alone caused the difference.
Sources: National Core Indicators — NCI-IDD 2024–25 In-Person Survey; ThinkWork / StateData — Employment Data for People with Intellectual and Developmental Disabilities; Special Olympics — National Snapshot of Adults with Intellectual Disabilities in the Labor Force; ThinkWork — The Pathway From Education to Employment: From College to Career Project.
Related articles:
Disability and Employment Statistics
Autism Employment Statistics 2026
Neurodiversity Statistics 2026: Workplace, Employment & Population Data
Comments are closed