

AI in the Workplace Statistics 2026: Adoption, Use & Impact
Artificial intelligence is becoming a routine part of work for a growing share of employees and businesses, but workplace AI statistics often measure very different things. A company reporting AI adoption is not the same as an employee using generative AI every day, and reported time savings are not the same as measured productivity.
The strongest available evidence shows rapid but uneven adoption across workers, businesses, occupations, and industries. U.S. surveys now track both employee use and business adoption, while workplace experiments show that AI can improve performance on some tasks without producing the same effect in every role or setting.
This article brings together the latest AI in the workplace statistics on adoption, frequency of use, productivity, time savings, staffing, and employee experience. For evidence focused specifically on layoffs, hiring changes, and jobs lost or displaced by AI, see our AI Job Displacement Statistics research.
AI in the Workplace Statistics and Numbers: (Editor Picks)
- Workplace GenAI use: About 27% of employed U.S. respondents aged 18–64 used GenAI for work in the previous week, in pooled August and November 2024 surveys.
- Daily AI use: About 10% of the same employed U.S. respondents reported GenAI use every workday in the previous week.
- Business adoption: Roughly 17%–20% of U.S. nonfarm employer businesses reported AI use in the previous two weeks across Census periods ending December 14, 2025–May 3, 2026.
- Large employers: 37% of firms with 250 or more employees reported using AI in the May 3, 2026 Census estimate.
- Mid-sized employers: 32% of firms with 100–249 employees reported AI use in the same estimate.
- SME adoption: About 31% of surveyed SMEs across seven countries reported GenAI use in October–December 2024; the United States was not included.
- Staffing unchanged: Among GenAI-using SMEs in that seven-country survey, 83.0% reported no change in their overall need for staff.
- Lower staff need: 9.1% of GenAI-using SMEs reported a decrease in staff need.
- Higher staff need: 5.5% of GenAI-using SMEs in the same survey reported an increase in staff need.
- Reported time savings: In November 2024, U.S. workers’ reported GenAI time savings were equivalent to about 1.4% of total work hours, including nonusers.
- Lesson preparation: A 2024 randomized trial in England found adjusted weekly science-lesson and resource preparation time of 56.2 minutes with ChatGPT versus 81.5 minutes in the control group.
- Developer productivity can vary: An early-2025 trial of experienced open-source developers on familiar repositories found 19% longer measured task completion time when AI was allowed.
- Cybersecurity adoption: In ISC2’s July–August 2025 international workforce survey, 28% of respondents reported AI security-tool integration, 19% testing and 22% evaluation; among active AI security-tool users, 63% reported a significant productivity boost.
Table of Contents
- How Many Workers Use AI at Work?
- How Many Businesses Use AI?
- Employee Use and Business Adoption Are Not the Same Thing
- How Quickly Is Workplace AI Adoption Growing?
- Which Workers Use AI Most at Work?
- Which Industries and Businesses Use AI Most?
- What Are Employees Using AI for at Work?
- AI and Workplace Productivity Statistics
- How Much Time Does AI Save at Work?
- How Is AI Changing Workloads and Staffing?
- Employee Attitudes Toward AI at Work
- AI Training and Skills in the Workplace
- Major Workplace AI Adoption Estimates Compared
- Why Workplace AI Statistics Differ
- What Can We Conclude About AI in the Workplace in 2026?
- Data Limitations
- Methodology and Source Selection
- Frequently Asked Questions
How Many Workers Use AI at Work?
AI use at work is already substantial, but the percentage depends on how use is defined. Weekly use, daily use, and any previous use are different measures and should not be treated as interchangeable.
In pooled August and November 2024 U.S. survey data covering employed respondents aged 18–64:
- About 27% used generative AI for work in the previous week.
- About 10% used generative AI every workday in the previous week.
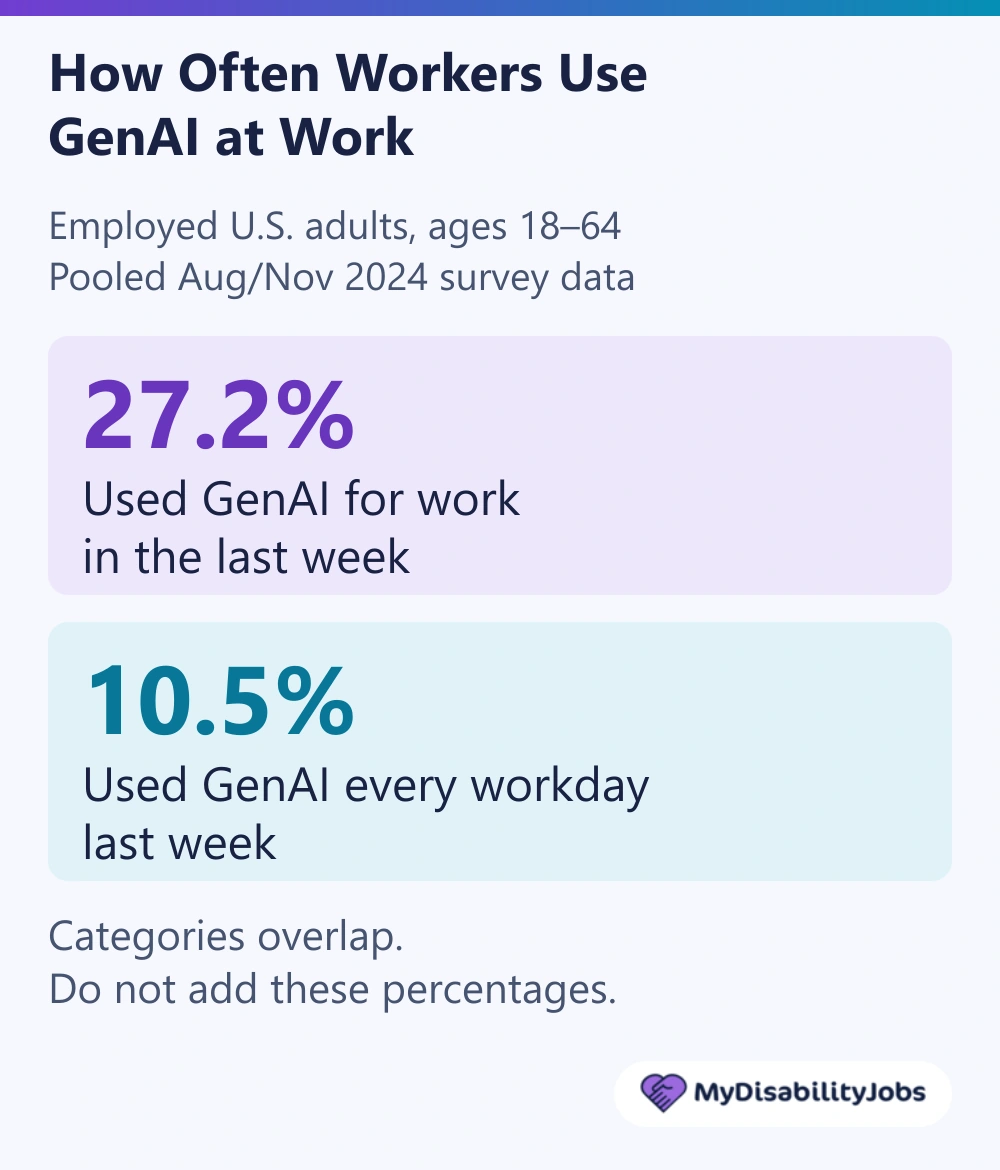
Daily users are included in weekly users, so these percentages cannot be added. The estimates come from 6,935 employed respondents in a weighted online survey; broader adult GenAI adoption includes people outside employment and use outside work.
Source: Bick, Blandin & Deming, The Rapid Adoption of Generative AI
How Many Businesses Use AI?
Business adoption measures whether a firm reports using AI, rather than how many employees use it. U.S. Census Bureau estimates cover nonfarm employer businesses and ask about AI use during the preceding two weeks.
- 17%–20% of businesses reported AI use across the audited collection periods ending December 14, 2025 through May 3, 2026.
- 37% of firms with 250 or more employees reported AI use in the collection period ending May 3, 2026.
- 32% of firms with 100–249 employees reported AI use in the same period.
The Census AI question broadened in November 2025 from use in producing goods or services to use in any business function. Earlier and later estimates therefore do not form one fully comparable trend. These firm-level figures cannot establish employee adoption.
Sources: U.S. Census Bureau, business AI use; U.S. Census Bureau, AI question wording update
Employee Use and Business Adoption Are Not the Same Thing
A business can report AI use without every employee using it. Likewise, an employee’s use of a tool and an organization’s adoption decision answer different questions.
| Measure | What it counts | Why it matters |
|---|---|---|
| Business adoption | Businesses reporting AI use. | A firm counts as an adopter even when use is limited to part of its operations. |
| Employee workplace use | Employed respondents reporting their own AI or GenAI use for work. | The denominator is people, not firms; technology and recall period still matter. |
| Frequent/daily use | Respondents meeting a stated usage-frequency threshold. | Daily use is a subset of broader use, not an additional group to add to it. |
| Within-firm employee use | The share of an adopting firm’s workforce that uses AI. | This needs a direct employee-share measure; business adoption alone does not supply it. |
For example, the Census AI supplement, fielded from November 17, 2025 to February 8, 2026, found that about 23% of firms reported worker AI task use. That counts firms reporting such activity, not the percentage of individual workers using AI or the share using it within each firm.
Employment-weighted business adoption also gives larger firms more weight; it does not show that every employee personally uses AI. Multiplying a business-adoption rate by a within-firm percentage cannot establish a national worker-use rate.
Sources: Federal Reserve, comparing AI adoption measures; U.S. Census Bureau, 2026 AI supplement research
How Quickly Is Workplace AI Adoption Growing?
Repeated waves of the same survey provide a clearer view of growth than a sequence assembled from different studies. Among U.S. employees aged 18 and older working for organizations, frequent and daily AI use increased across these waves.
| Survey wave | Frequent AI use | Daily AI use |
|---|---|---|
| Q3 2025 | 23% | 10% |
| Q4 2025 | 26% | 12% |
| Q1 2026 | 28% | 13% |
| Q2 2026 | 30% | 15% |
Frequent use means at least a few times a week and includes daily use. The Q2 2026 wave surveyed 22,573 employees from May 6–20; these are broad AI measures, not exclusively GenAI.
Do not combine these employee rates with Census business adoption or differently defined GenAI surveys into one trend. AI definitions and denominators differ, and the November 2025 Census wording change creates a separate break in comparability.
Sources: Gallup, Q4 2025 workplace AI use; Gallup, Q2 2026 workplace AI use; U.S. Census Bureau, AI question wording update
Which Workers Use AI Most at Work?
Workplace AI use varies by occupation and role. The comparisons below describe U.S. respondents within each named group; they use different periods and frequency measures.
- 54% of employed respondents in computer and mathematical occupations reported any workplace GenAI use in pooled August and November 2024 data, compared with 16% in personal services.
- 52% of employed respondents in management occupations and 48% in business and finance reported any workplace GenAI use in the same 2024 data.
- 44% of leaders, 30% of managers and 23% of individual contributors reported frequent AI use in Q4 2025.
- 40% of employees in remote-capable roles reported frequent AI use in Q4 2025, compared with 17% in non-remote-capable roles.
The occupational analysis covers 6,883 employed respondents aged 18–64 in a weighted online survey. The Q4 role comparisons come from a Gallup wave of 22,368 organizational employees aged 18+; subgroup sample counts were not reported. Frequent means a few times weekly or more. These are historical group differences, not proof that age, occupation or remote work causes adoption.
Sources: Bick, Blandin & Deming, The Rapid Adoption of Generative AI; Gallup, Q4 2025 workplace AI use
Which Industries and Businesses Use AI Most?
Alongside the firm-size differences above, industry and business function help show where AI is being used. For the collection period ending May 3, 2026, Census reported the following shares of U.S. employer businesses using AI during the preceding two weeks.
| Industry | Businesses reporting AI use |
|---|---|
| Information | 39.7% |
| Finance and insurance | 33.9% |
| Retail trade | About 14% |
Business-function results use a different denominator: U.S. firms already using AI in at least one function. In the AI supplement fielded November 17, 2025–February 8, 2026, covering use in the previous six months:
- 52% of these adopting firms used AI in sales and marketing.
- 45% used AI in strategy and business development.
- 41% used AI in information technology.
- 57% used AI in only one to three business functions.
The industry percentages count businesses within each sector; the function percentages count adopting firms and can overlap. Neither is an employee-use percentage.
Sources: U.S. Census Bureau, business AI use; U.S. Census Bureau, 2026 AI supplement research; ISC2, 2025 Cybersecurity Workforce Study
What Are Employees Using AI for at Work?
Writing, finding information and solving problems were common uses among U.S. employees who used AI at work. In the May 6–20, 2026 Gallup survey, workplace AI users reported:
- 51% used AI for writing and editing.
- 49% used AI for search or research.
- 39% used AI for general assistance or problem-solving.
These percentages refer to AI users within a survey of 22,573 organizational employees aged 18+, not all employees. Respondents could select multiple uses, and the AI-user subgroup sample count was not reported. Using AI for particular tasks does not mean that the whole job is automated.
Source: Gallup, Q2 2026 workplace AI use
AI and Workplace Productivity Statistics
AI can improve performance on some workplace tasks, but the size and even the direction of the effect depend on the worker, task, tool and outcome being measured. These studies do not establish one universal AI productivity boost.
| Result | What was measured | Study scope |
|---|---|---|
| 15% more issues resolved per hour with AI assistance, on average. | Customer-support task output per hour. | 5,172 agents at one U.S. software firm, mainly working in the Philippines. Staggered rollout mainly in fall 2020 and winter 2021; a quasi-experiment, not a randomized trial. |
| An estimated 26.08% more completed tasks among AI-tool users; standard error 10.3%. | Weekly pull requests, a measure of developer task output. | 4,867 developers across three randomized-access experiments in 2022–2023. Microsoft participants were mostly U.S.-based; Accenture participants were in Southeast Asia; the third firm’s location was undisclosed. |
| 19% longer task completion time when AI was allowed; 95% confidence interval: 2%–39% longer. | Recorded time to complete development tasks. | 16 experienced open-source developers completing 246 tasks on familiar repositories, using February–June 2025 tools. Tasks were randomly assigned to allow or disallow AI. |
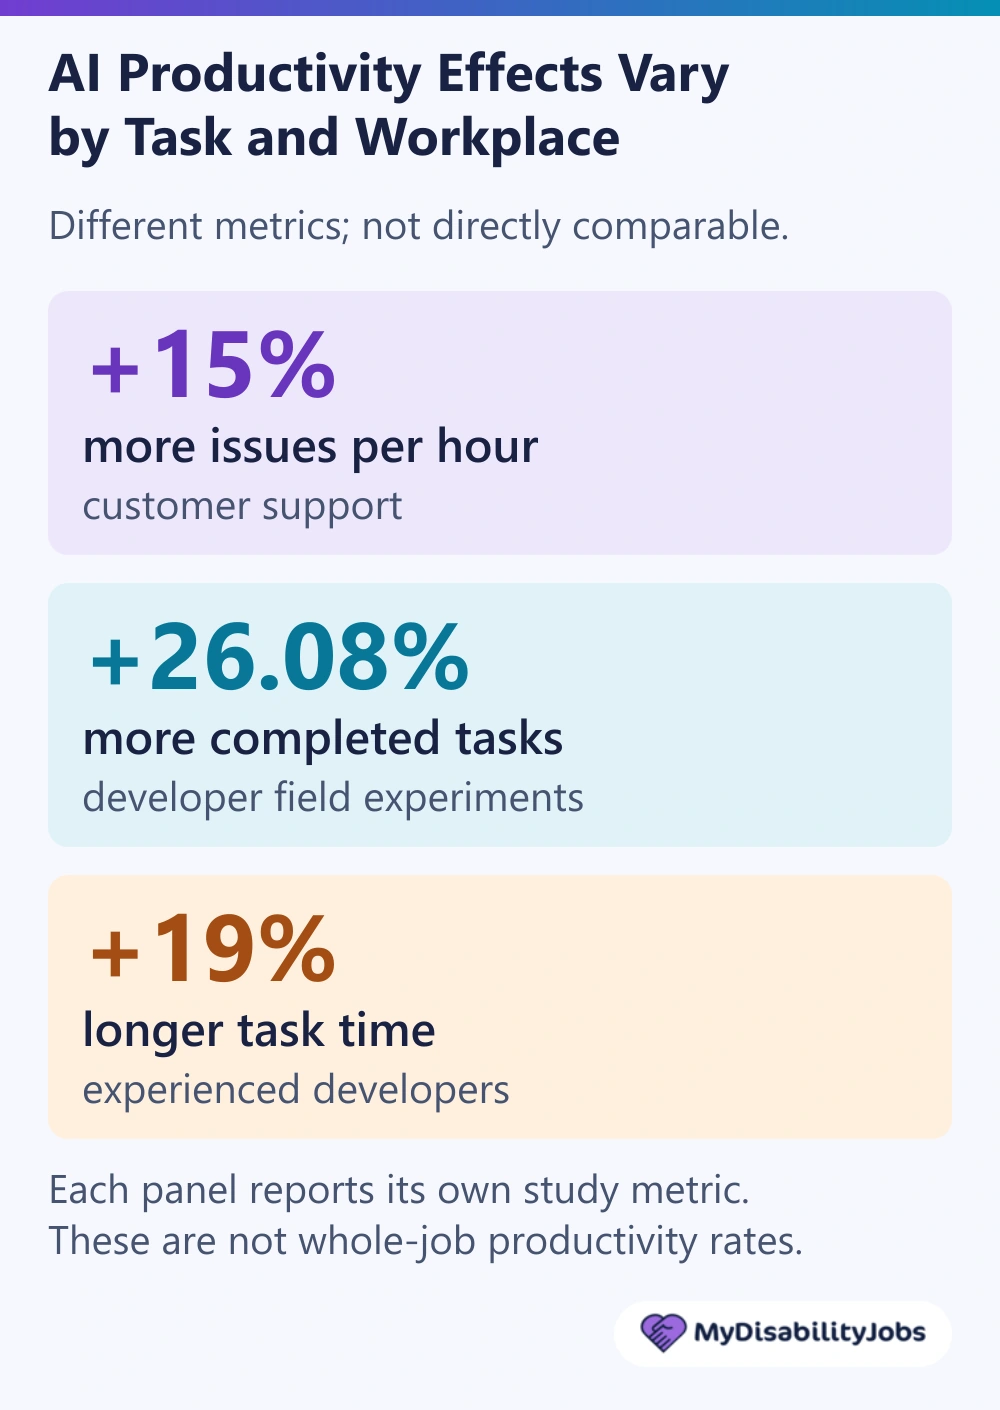
The developer output estimate measures the effect of tool use inferred from randomized access, rather than simply comparing everyone offered access with everyone else. In the completion-time trial, the positive 19% increase means tasks took longer; it is not a 19% reduction in overall job productivity.
These outcomes concern particular tasks and settings, not entire occupations or workweeks.
Sources: Brynjolfsson, Li & Raymond, Generative AI at Work; Cui et al., developer field experiments; METR, early-2025 developer trial
How Much Time Does AI Save at Work?
Time saved is more concrete than a broad productivity claim, but reported savings and experimentally studied task times still measure different things.
- About 1.4% of total work hours: reported GenAI time savings across U.S. workers, including nonusers, in November 2024. Among past-week workplace GenAI users, reported savings averaged 5.2% of hours. The time-savings distribution covered 925 employed respondents aged 18–64 who had used GenAI at work that week.
- 56.2 versus 81.5 minutes per week: adjusted science-lesson and resource preparation time with ChatGPT versus control in an England teacher trial. The difference was 25.3 minutes, or 31%, for the specified preparation tasks during weeks six to ten.
The worker survey asked how much extra time the same work would have required without GenAI and capped reported savings at four hours. The April–July 2024 school-randomized trial used teacher diaries, with 211 teachers in 66 schools in the primary analysis, from 259 teachers in 68 schools randomized. Its result covers Year 7/8 science preparation with ChatGPT plus guidance, not teachers’ whole working week. Neither finding establishes an equivalent reduction in paid working hours.
Sources: Bick, Blandin & Deming, The Rapid Adoption of Generative AI; EEF/NFER, ChatGPT in Lesson Preparation
How Is AI Changing Workloads and Staffing?
Changes in the need for staff and changes in workload are separate outcomes. An OECD survey of 5,232 SMEs, fielded October 14–December 6, 2024, covered Austria, Canada, Germany, Ireland, Japan, Korea and the United Kingdom. About 31% reported GenAI use.
Among GenAI-using SMEs in that seven-country survey:
- 83.0% reported no change in their overall need for staff.
- 9.1% reported a decrease in staff need.
- 5.5% reported an increase in staff need.
Workload responses were a separate measure, also among GenAI-using SMEs:
- 32.7% reported decreased staff workload.
- 11.8% reported increased staff workload.
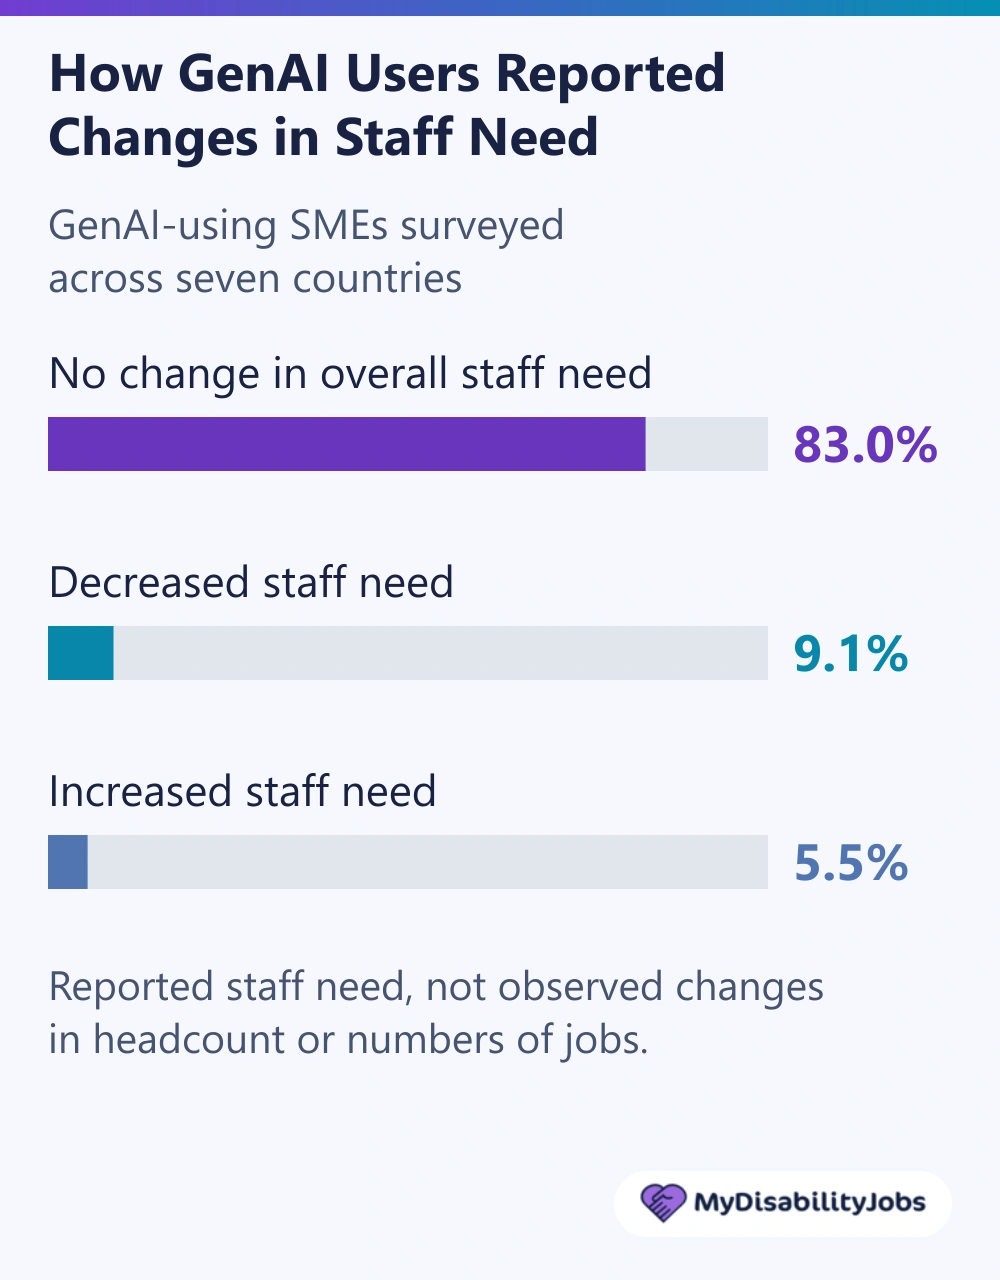
These are business respondents’ assessments. Staff need is not realized headcount, and workload responses do not measure employee working hours. The staffing figures do not form an exhaustive 100% split or provide a net-job estimate; they cannot be converted into layoffs or jobs created.
Sources: OECD, SME GenAI adoption; OECD, staff need and workload; OECD, survey methodology
Employee Attitudes Toward AI at Work
Workers can feel both concern and hope about AI. A Pew Research Center survey conducted October 7–13, 2024 covered 5,273 employed U.S. adults with one job or an identified primary job and asked about feelings toward future workplace AI use.
- 52% felt worried about how AI may be used in the workplace in the future.
- 36% felt hopeful about future workplace AI use.
The percentages use the full eligible-worker denominator, including 17% who had not heard of workplace AI and were not asked the feelings question; 4,538 respondents were asked. Feelings can overlap. These historical attitudes are not forecasts of what AI will do or measures of current trust.
Sources: Pew Research Center, worker attitudes toward AI; Pew Research Center, survey questions and topline
AI Training and Skills in the Workplace
Training participation and perceived skills gaps are different measures. The OECD findings below come from its seven-country survey of 5,232 SMEs, fielded October 14–December 6, 2024; the U.S. finding uses a separate, conditional worker sample.
- 23.6% of GenAI-using SMEs said employees currently participated in AI-related training, compared with 2.7% of nonusing SMEs. These are shares of businesses, not the percentage of employees trained.
- 49.8% of nonusing SMEs agreed that their employees lacked the right skills to use GenAI. This is a reported barrier, not a tested skills assessment.
- 24% of U.S. workers who had taken job-skills classes or training in the previous year said some related to AI. This Pew result, surveyed October 7–13, 2024, applies to 2,860 training recipients with one job or an identified primary job, not all workers.
These findings do not establish a current U.S. workforce-wide training rate, certified skill levels or a causal productivity benefit from training.
Sources: OECD, AI training and skills barriers; Pew Research Center, survey questions and topline
Workplace AI Adoption Estimates Compared
Workplace AI adoption estimates can differ sharply without contradicting one another. Surveys may count businesses, employees, recent users, daily users, or employees within adopting firms, and they may measure broad AI or generative AI.
| Source / period | Main estimate | What it measures / key limitation |
|---|---|---|
| Bick, Blandin & Deming — U.S., Aug/Nov 2024 (pooled) | GenAI: 32.1% any; 27.2% last week; 10.5% every workday last week. | Self-reported work use; 6,935 employed adults, ages 18–64. Weighted online panel, not a random sample; historical data; frequency groups overlap. |
| GenAI Adoption Tracker — U.S., May 2026 | 45.2% used GenAI for work. | Reported work use; employed adults, ages 18–64. May sample size and exact field days unavailable; not a full-year rate. |
| Census BTOS — U.S., period ending May 3, 2026 | 19.8% of firms used AI. | Broad AI, prior two weeks; firm-weighted nonfarm employers, not worker use. November 2025 wording break; dated May snapshot. |
| Gallup — U.S., May 6–20, 2026 | AI: 52% any; 30% frequent; 15% daily. | Self-reported broad AI, not just GenAI; 22,573 organizational employees, ages 18+. Frequent = a few times weekly or more; any includes infrequent use; groups overlap. |
| OECD — seven countries*, Oct. 14–Dec. 6, 2024 | 30.7% of SMEs used GenAI. | 5,232 SMEs, one-person firms through 249 employees; owner/manager reports of own or colleague use. Cross-country average, not global or U.S.; firms, not individual workers. |
| Federal Reserve — U.S.; BTOS: Dec. 2025; SBU: Nov. 2025 | AI: BTOS 18% firm-weighted; SBU 78% employment-weighted. SBU LLM: 54% employment-weighted. | Firm adoption; different weights, technologies and firm mix. SBU: 1,032 executives; jobs at adopting firms, not personal use. BTOS: four-period moving average. |
*OECD countries: Austria, Canada, Germany, Ireland, Japan, Korea and the United Kingdom.
- These estimates should not be averaged into one workplace AI adoption percentage.
- Business adoption and employee use answer different questions: adoption by a firm does not mean every employee uses AI.
- Broad AI, GenAI and frequent AI use have different definitions; compare the technology and usage threshold as well as the percentage.
Sources: Bick, Blandin & Deming, The Rapid Adoption of Generative AI; Bick, Blandin & Deming, GenAI Adoption Tracker; U.S. Census Bureau, business AI use; Gallup, Q2 2026 workplace AI use; OECD, SME GenAI adoption; OECD, survey methodology; Federal Reserve, comparing AI adoption measures
Why Workplace AI Statistics Differ
Two AI workplace statistics can both be accurate while reporting very different percentages because they may measure different populations, technologies, or levels of use.
- Unit of analysis: firms, individual workers and employees within adopting firms are different denominators. Employment-weighted adoption does not measure personal use.
- Technology: broad AI, generative AI and large language models (LLMs) do not cover identical tools.
- Frequency: any use, use in the previous week, daily use and frequent use have different thresholds. Gallup defines frequent use as a few times a week or more.
- Question wording: the broader Census question introduced in November 2025 creates a break in the business-adoption series.
- Geography and sample: a U.S. employee panel, a seven-country SME survey and a study at one employer describe different populations.
- Outcome: adoption, productivity, time savings, staffing need and attitudes answer separate questions. A change in one does not establish a change in the others.
- Evidence type: reported use or perceived time savings differs from recorded task output. Randomized experiments and observational studies also support different causal conclusions.
For that reason, workplace AI studies should be compared by denominator and methodology rather than combined into a single adoption rate.
Sources: Federal Reserve, comparing AI adoption measures; U.S. Census Bureau, AI question wording update; Gallup, Q2 2026 workplace AI use; Bick, Blandin & Deming, The Rapid Adoption of Generative AI; Brynjolfsson, Li & Raymond, Generative AI at Work
What Can We Conclude About AI in the Workplace in 2026?
AI is now a meaningful part of workplace activity, but adoption remains uneven and its effects vary substantially by worker, business, task, and industry.
- Worker use is substantial, but daily use is less common than broader use. In Gallup’s May 6–20, 2026 U.S. employee survey, 30% used AI at least a few times weekly and 15% used it daily.
- Business adoption is substantial but not universal. Census placed use at roughly 17%–20% across its audited December 2025–May 2026 periods; in the May 3 estimate, use reached 37% among firms with 250 or more employees.
- Productivity effects depend on the setting. The customer-support study found higher output per hour, while the early-2025 trial of experienced developers on familiar repositories found longer task completion times. Neither provides a universal whole-job effect.
- Staffing need is not the same as realized employment. In the OECD’s seven-country 2024 SME survey, 83.0% of GenAI-using firms reported unchanged staff need; the responses do not establish layoffs or job creation.
- Employee attitudes include both worry and hope. Pew’s October 2024 U.S. worker survey found both feelings about future workplace AI use; these attitudes are not predictions of employment outcomes.
- Adoption, productivity and displacement remain separate outcomes. More use or faster completion of a task cannot, by itself, establish how many jobs have been lost or created.
The clearest picture in 2026 is one of rapid but uneven diffusion: AI is changing how work is performed, but there is no single adoption, productivity, or employment statistic that captures its workplace impact.
Sources: Gallup, Q2 2026 workplace AI use; U.S. Census Bureau, business AI use; Brynjolfsson, Li & Raymond, Generative AI at Work; METR, early-2025 developer trial; OECD, staff need and workload; Pew Research Center, worker attitudes toward AI
Data Limitations
Workplace AI research is expanding quickly, but the evidence still has important limitations.
- Different denominators: firms, workers, AI users and training recipients cannot be treated as the same population.
- Self-reported measures: respondents’ use, time savings and staffing assessments are not direct observations of output, hours worked or job losses.
- Changing definitions: broader technology categories or revised question wording can shift estimates without an equivalent change in behavior.
- Technology vintage: results apply to the tools available during a study, not automatically to current models.
- Task versus whole-job effects: faster lesson preparation or a change in coding time does not measure the effect on an entire working week.
- Generalizability: one employer, a small selected developer sample or SMEs in seven countries cannot represent all workplaces.
- Short observation periods: brief trials and survey snapshots do not establish persistent productivity or employment effects.
- U.S. AI-training evidence: the studies reviewed here do not establish a current, nationally comparable whole-workforce training rate; Pew’s historical measure covers only workers who received job-skills training.
Sources: Federal Reserve, comparing AI adoption measures; Bick, Blandin & Deming, The Rapid Adoption of Generative AI; U.S. Census Bureau, AI question wording update; METR, early-2025 developer trial; EEF/NFER, ChatGPT in Lesson Preparation; OECD, survey methodology; Pew Research Center, survey questions and topline
Methodology and Source Selection
Research library verified September 27, 2026.
MyDisabilityJobs prioritizes government datasets, peer-reviewed research, university studies, Federal Reserve research, original worker and employer surveys, and major institutional research with transparent methods.
- Original publications were reviewed where available, rather than relying only on secondary summaries.
- Geography, sample, denominator and field period are retained so readers can see who and what each estimate describes.
- Business adoption, employee use, frequency, productivity, time savings, staffing and attitudes are treated separately.
- Measured performance is distinguished from self-reported productivity and perceived time savings.
- The latest verified versions in the research library are used; historical observations retain their data dates.
- Incompatible survey rates are not averaged into a single workplace AI adoption percentage.
- This is a curated editorial research library, not an exhaustive formal systematic review.
Frequently Asked Questions
In Gallup’s May 6–20, 2026 survey of 22,573 U.S. organizational employees aged 18+, 52% reported any AI use at work, 30% used it at least a few times weekly, and 15% used it daily. These are overlapping frequency groups for broad AI, not exclusively generative AI.
The U.S. Census BTOS estimate for the collection period ending May 3, 2026 was 19.8% of nonfarm employer businesses using AI during the preceding two weeks. This counts firms, not employees, and measures broad AI rather than GenAI alone. It is the audited May snapshot, not a full-year estimate.
Gallup’s U.S. employee surveys show frequent AI use rising from 28% in Q1 2026 to 30% in Q2, while daily use rose from 13% to 15%. The surveys ran February 4–19 and May 6–20, respectively; frequent use means at least a few times weekly. These employee-use measures should not be combined with business-adoption rates into one trend.
It can, but results vary by task and setting. A study of 5,172 customer-support agents during a rollout mainly in 2020–2021 found 15% more issues resolved per hour with AI assistance. A separate early-2025 randomized trial involving 16 experienced developers and 246 tasks on familiar repositories found 19% longer completion times when AI was allowed. Neither establishes a universal whole-job productivity effect.
In November 2024 U.S. survey data, workers’ reported GenAI time savings amounted to about 1.4% of total work hours, including nonusers. This was self-reported counterfactual time saved, not an observed reduction in working hours or a measured whole-job productivity gain. Savings on a particular task should not be applied to an entire working week.
Among GenAI-using SMEs in the OECD’s seven-country survey, fielded October 14–December 6, 2024, 9.1% reported lower staff need, 5.5% higher need, and 83.0% unchanged need. The countries did not include the United States. These responses concern staffing need, not verified layoffs, hiring or numbers of jobs affected.
Workplace adoption and productivity statistics alone cannot establish how many jobs AI has replaced. Reported reductions in staffing need also do not measure realized job losses. For evidence focused on employment outcomes, see our AI Job Displacement Statistics research.
Comments are closed